

Liquidity Providers on Uniswap V3
TL;DR
- We analyzed the liquidity across six Uniswap V3 pools (3 token pairs), targeting one of each: stable-stable, volatile-volatile, and stable-volatile asset pairs.
- We compared LP preferences for the two most popular fee tiers in each pool.
- We noted different patterns in the risk appetites of LPs in “lower fee” vs. “higher free” pools.
- We concluded that lower fee pools attract higher average liquidity-per-wallet, while higher fee pools attract LPs with lower average liquidity amounts.
On-chain liquidity is fundamental to DeFi’s value proposition. Its availability is what allows DeFi markets to remain decentralized, collusion-resistant, efficient, and constantly operational.
On-chain liquidity relies on the work of individuals and institutions that choose to allocate their funds in AMM pools in exchange for financial rewards in the form of trading fees. Liquidity providers (LPs) are in a constant decision-making process of mitigating risk while maximizing reward, opportunity, and efficiency.
This is increasingly the case for those participating in new AMM models such as the concentrated liquidity pools introduced by Uniswap V3. These pools offer LPs granular control over how they choose to allocate their capital by segmenting the price curve into “ticks” and allow them to choose between different fee pool tiers, typically starting at 0.01%.
Uniswap V3 Pool Analyses
Uniswap V3’s pools are some of the largest in DeFi; and there is a lot to glean from the behavior of the LPs participating in these pools. We can get a better sense of their mentality and decision making process by looking at how capital is concentrated in some of the most popular token pairs.
This post dissects the profile of liquidity providers across three of the highest-liquidity token pairs on Uniswap V3:
- Volatile-volatile: WBTC/WETH
- Stable-volatile: USDC/ETH
- Stable-stable: DAI/USDC
For each token pair, we look at the two fee tiers that attract the highest amounts of liquidity and thus fees. We have intentionally not analyzed outlier tiers.
For example, for USDC/ETH, we chose to analyze the 0.05% (“lower fee”) and 0.3% (“higher fee”) pools. The USDC/ETH 1% pool, by comparison, fetches significantly lower volume and fees (e.g. on April 5th at 11:59pm UTC, the 0.05% pool fetched over $210k in fees, compared to <$400 in the 1% pool in the previous 24 hour period). To appropriately measure liquidity behavior, therefore, we observed only the two pools with the highest volumes and fees for each token pair.
Generally, the more stable pairs (like stable-stable assets or assets that are more price correlated like BTC/ETH) gravitate towards lower fee percentages, whereas the more volatile crypto pairs trend closer to 1%.
Note: the following analysis takes into account some data presumptions. See “Appendix: Data Methodology” for more insight into our data approach.
Volatile-Volatile: WBTC/WETH
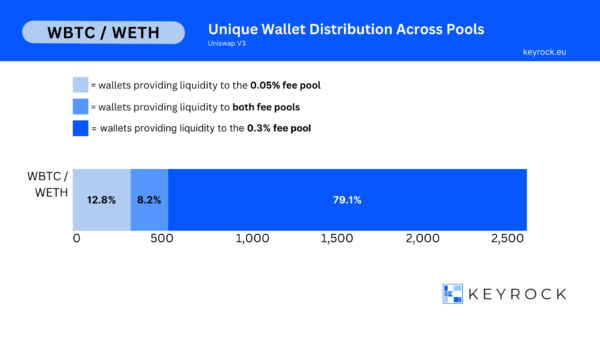
WBTC/WETH is the largest pool by liquidity volume that we analyzed due to the popularity of both assets. It reflects a more common pattern among volatile assets where LPs tend to gravitate towards the higher 0.3% fee tier.
WBTC/WETH “Lower Fee” = 0.05%
WBTC/WETH “Higher Fee” = 0.3%
There is $356.3MM locked across the two pools, with 71% ($254.8MM) locked in the higher fee tier and 29% ($101.5MM) locked in the low tier.
There are over 2,600 LPs across both pools, and the difference in their distribution across the pools is considerable. 79.1% of LPs are contributing to the higher fee pool. 12.8% are contributing to the lower fee pool. A surprising 8.2% of wallets are simultaneously LPing in both pools.
Volatile-Volatile Takeaways
LPs heavily prefer the higher fee pool, though the average liquidity per wallet for LPs in the higher fee pool is nearly half that of the average liquidity per wallet in the lower fee pool.
This observation, which we see in other pools to an even greater degree, confirms our macro conclusion that higher-volume LPs prefer to take lower-risk positions on these big pools.
The clear preference for the higher fee pool alongside the similarity of the individual liquidity breakdown reveals the LP mindset towards the WBTC/WETH token pair. LPs are likely more confident that ETH and BTC prices will remain correlated, resulting in less risk of impermanent loss. This leads LPs to overwhelmingly prefer the higher fee pool to maximize their returns while accepting the associated risk.
Stable-Volatile: USDC/ETH
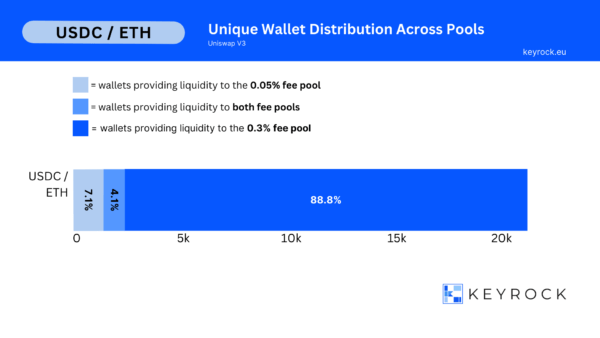
The second largest pool we’ve analyzed showcases the behavior of LPs in the context of a stable-volatile pair. We looked at two pools:
USDC/ETH “Lower Fee” = 0.05%
USDC/ETH “Higher Fee” = 0.3%
There is $387.1MM locked across both pools, with 70% ($270.7MM) in the lower fee pool and 30% ($116.4MM) in the higher fee pool.
There are over 21,000 LPs, with 88.8% preferring the higher fee pool and just 7.1% preferring the lower fee pool. 4.1% are providing liquidity to both pools simultaneously.
Stable-Volatile Takeaways
The higher fee pool has a significantly lower average wallet liquidity. This supports the overall analysis that smaller LPs prefer the higher fee pool, presumably because they aim to maximize their rewards on LPing this token pair despite their smaller liquidity amounts.
Stable-Stable: DAI/USDC
Stable-Stable: DAI/USDC
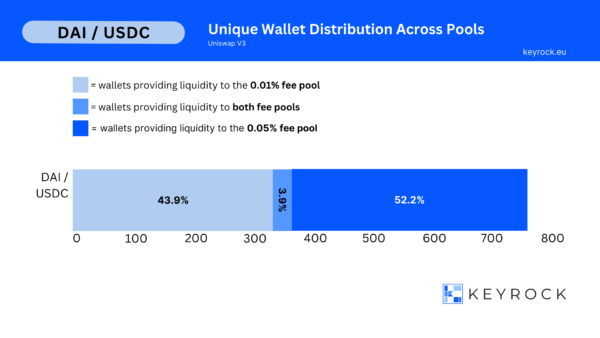
As is common for stablecoin pairs, most of the LPs in the DAI/USDC pools choose the 0.01% and 0.05% fee tiers. This is because the volatility of these assets is low, by design, and most of the market participants will look to trade as close to 1:1 as possible and expect to pay lower fees.
DAI/USDC and USDC/USDT “Lower Fee” = 0.01%
DAI/USDC and USDC/USDT “Higher fee” = 0.05%
There is ~$171.2MM in total liquidity locked across both pools, with a majority of it — 36.6% ($62.52MM) — in the higher fee tier. The remaining 63.6% of that liquidity ($108.7MM) is in the lower fee tier.
These funds are provided by ~770 individual LPs across the two DAI/USDC pools. 43.9% of wallets are providing liquidity to just the lower fee pool. 52.2% of wallets are providing liquidity to the higher fee pool. The remaining 3.9% of wallets (82) are LPing to both pools.
A quick analysis of the 3.5% of wallets that are providing liquidity to both pools does not suggest an intentional and sophisticated strategy to maximize fee rewards. A notable number of these wallets are not consciously choosing to switch between pools, but are rather providing liquidity through an automated service, which is reallocating their liquidity behind the scenes.
Stable-Stable Takeaways
The breakdown of USDC/DAI liquidity across both fee pools reflects the mindset of large vs. small LPs. Within the lower fee pool (0.01%), we see fewer LPs but higher average wallet liquidity. The higher-fee, higher-risk pool reflects the mindset of smaller LPs. These LPs are accepting a higher risk profile to make up for their smaller average positions with the higher fee pool (0.05%).
With lower fees for stable pools, on the other hand, large LPs are comfortable reaping a smaller fee percentage for less risk in their position, allowing their large LP positions to still make a considerable return without the pressure of managing their position actively. To validate these conclusions, we also observed the USDC/USDT token pair across the same fee rates: 0.01% and 0.05%. Our conclusions were upheld, and the behavior of LPs in the USDC/USDT pool match that of LPs in the DAI/USDC pools.
Macro Observations
Despite the different makeup across stable and volatile tokens, we find some consistent patterns in the preferences of LPs across these pools:
- Lower-fee tiers attract higher average liquidity-per-wallet as large LPs don’t feel as pressured to maximize their returns with more risk associated with the higher-fee tiers.
- Higher-fee tiers attract LPs with lower liquidity volumes, as they are willing to take the risk associated with higher fees in order to make the most out of their lower liquidity provision.
- Stable pools (USDC/DAI, USDC/USDT) are fairly evenly distributed across the number of LPs (especially in comparison to pairs that include volatile assets).
- Very few wallets are providing liquidity to both fee pools of a token pair, and the wallets that are doing so are typically associated with an automated LP service.
- In most of the higher-fee pools, we saw at least one major outlier that LP’d the most out of both pools, but took the risk associated with the higher fee market.
Stay tuned for more studies looking at the patterns in liquidity and LP behavior in DeFi markets. Learn more about Keyrock.
Follow us on Twitter
Appendix: Data Methodology
The data for this post was pulled on April 5, 2023. Our methodology was as follows:
- We retrieved the list of wallets that interacted with each pool through the action of adding or subtracting liquidity.
- We checked the current balance of each wallet and removed the ones with 0 balances.
- We calculated the aggregate metrics (mean size, max wallet liquidity, etc.).
It is worth noting that on-chain data is imperfect. It is difficult to get the exact number of liquidity providers; that would require iterating through every single wallet and checking the balance of the LP token. We opted for an approximation that we still feel confident reflects the behavior of LPs in each pool. We analyzed the wallets that interacted with each liquidity pool by adding or removing liquidity, and then filtered the list by checking the balance of those wallets.
Read more: L1: How the new non-EVM faves build their DeFi ecosystem
- Looking for a liquidity partner? Get in touch
- For our announcements and everyday alpha: Follow us on Twitter
- To know our business more: Follow us on Linkedin
- To see our trade shows and off-site events: Subscribe to our Youtube
Questions
Lorem ipsum dolor sit amet, consectetur adipiscing elit. Vestibulum id ligula porta felis euismod semper.