Navigating the shadows: Wash trading and its effect on crypto markets
In the obscure corners of financial markets, wash trading casts a long shadow over exchanges. This deceptive manoeuvre simulates market activity to mislead observers. We dissect its mechanics, expose its signals, and reveal why vigilance is paramount. Let’s get into it.
What is wash trading?
Wash trading is a deceptive practice in the financial market that has made its way to cryptocurrency markets. It involves artificially creating the appearance of trading activity by an individual trader or an entity. Wash traders generate fake trading records to clear their standing limit orders. Meaning that they’re buying and selling to themselves.
But to the trained eyes, there are clear patterns associated with wash trading. Here are some signs:
- Consistent Volume: The traded volume remains the same over a specific timeframe, showing no variance.
- Unusual Depth-to-Volume Ratio: Despite high volume, there is technically no depth in the market.
- Consistent Clearing Prices: Bids and asks are virtually filled at the same price, implying there’s no spread in the market.
- Consistent Trade Sizes: Bids and asks keep having the same size or repeating a similar pattern over time.
Why does wash trading occur? The goal of wash trading is to create a false impression of high demand and artificially inflate the value of an asset in the market in hopes of deceiving other market participants.
Identifying and counteracting wash trading is crucial for maintaining financial markets’ integrity. As a market maker, our stance is clear: investors should be protected from fraudulent activities. Including wash trading. This is imperative for any big actor aspiring to ensure a fair and efficient trading environment.
Why is wash trading relevant to Crypto?
Wash trading poses critical challenges. It can negatively impact various aspects of the markets, including:
Market Integrity
It erodes the market’s credibility by simulating false trading momentum and liquidity. This can skew investor perception and distort market prices.
Investor Protection
Accurate, transparent market data are key for informed decision-making. Wash trading can be done with the premise of misleading investors, potentially leading to poor decisions.
Regulatory Compliance
This practice breaches legal frameworks set by financial watchdogs. Participants and exchanges caught in wash trading face severe penalties, including fines and sanctions. Upholding regulatory standards is vital for market fairness.
Market Stability
Artificial price fluctuations and volatility induced by wash trading threaten the market’s equilibrium. This challenges not only individuals but the overall financial ecosystem’s integrity.
Wash trading impact on a market maker
Wash trading damages markets’ integrity and obscures price discovery mechanisms. Such practices are outlawed across regulated stocks, derivatives, and commodities exchanges. A strong stance that’s lacking in numerous cryptocurrency exchanges. Read more about it here.
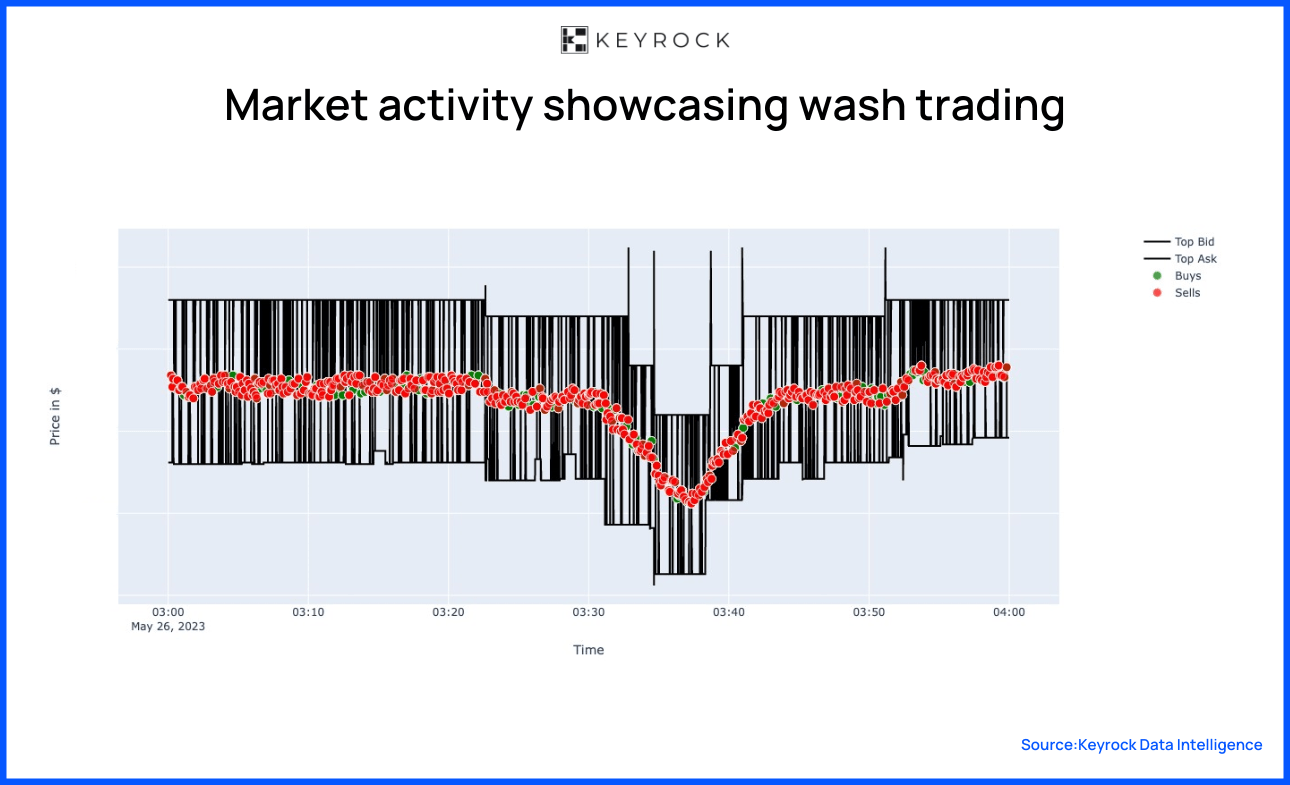
This manipulation involves executing transactions between the highest bid and the corresponding ask price, often by the same party. In the chart below, we observe a market we suspect is exhibiting washtrading activities. In this particular example, the trades are all at identical prices, hinting at self-trading.
Notorious cases of wash trading have set precedents in traditional finance. The LIBOR scandal is a good case in point. UBS traders executed nine wash trades, generating £170,000 in fees as incentives for a brokerage’s role in manipulating the LIBOR rates for the Japanese yen.
How do we detect wash trading?
Our Metrics
Spotting wash trading can be a dire task. Many parameters are to be considered. Without forgetting an astute expertise to uncover these patterns. But if we were to give a crash course on detecting wash trading, here’s how to look at 3 critical metrics:
Quality of the order book
Does the order book look healthy? We analyse the Volume vs. Depth Ratio. For example, $1m in volume / $100 in market depth is a significant signal that there’s potentially wash trading happening in that market.
Let’s look at a specific example. Below, we can see an undisclosed market in which all the buys and sells are exactly at the same price. There’s essentially no spread. And this doesn’t happen only once but over an extended period of time.

Quality of the Volume
Does the volume align with our expectations for a healthy market? For instance, if all volume occurs within 50bps, or the volumes remain remarkably consistent, almost fixed, at a certain daily quantity, say $1 million volume daily. One of the metrics we use to gauge the volume is the median versus average volume.
Looking at the Median vs. Avg volume of a market across exchanges, we expect a right skew in the market (median < mean). If the mean volume is higher than the median, the volume would suggest inconsistencies.

Quality of the trades
Do the trades look organic? What does the frequency of trade sizing look like? Do all trades have the same size, or do they follow a pattern commonly seen in markets, like a power law distribution? Understanding these dynamics helps us gauge the health of the trading activity.
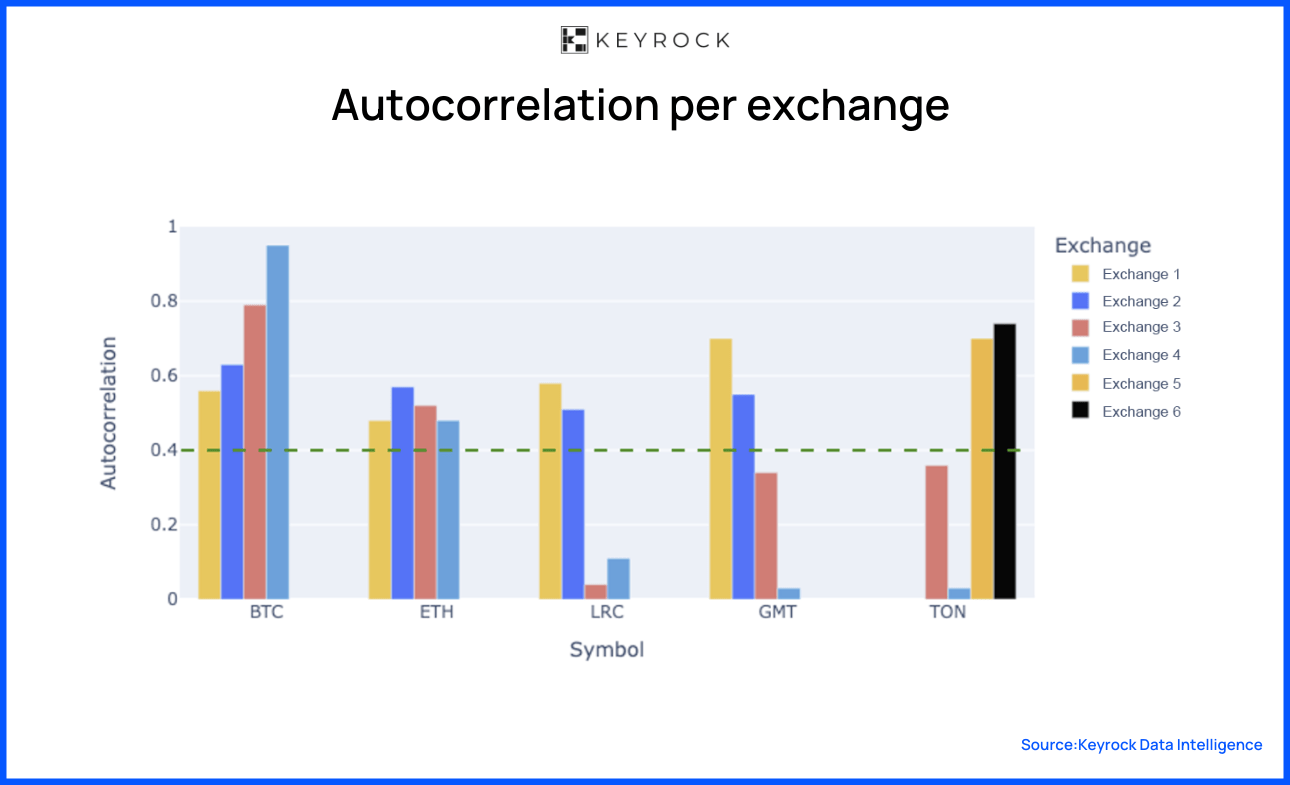
For example, assessing trade quality involves examining the unusual concentration of trades or the autocorrelation in order sign. That is, there is likely to be another buy order after a buy order. Autocorrelations lower than 0.40 suggest that the markets have wash trading.

By synthesising these metrics, we derive a comprehensive score for any given token, market, or exchange. This score enables us to detect wash trading activities.
Case Study: SOL Market
When investigating a particular market, we look at specific exchanges and token pairs.

Source: Keyrock Data Intelligence.
Note: Metrics displayed here are only for representational purposes.
In our mock-up data, the final score reveals the extent of wash trading within the market. For instance, a score of 0.29 indicates that 29% of the volume is organic, leaving 71% subject to wash trading.
But what are the practical implications?
We’ll use SOL/USDT as an example and assess transactions across different exchanges. We’ve chosen SOL as it is a high-liquidity market.
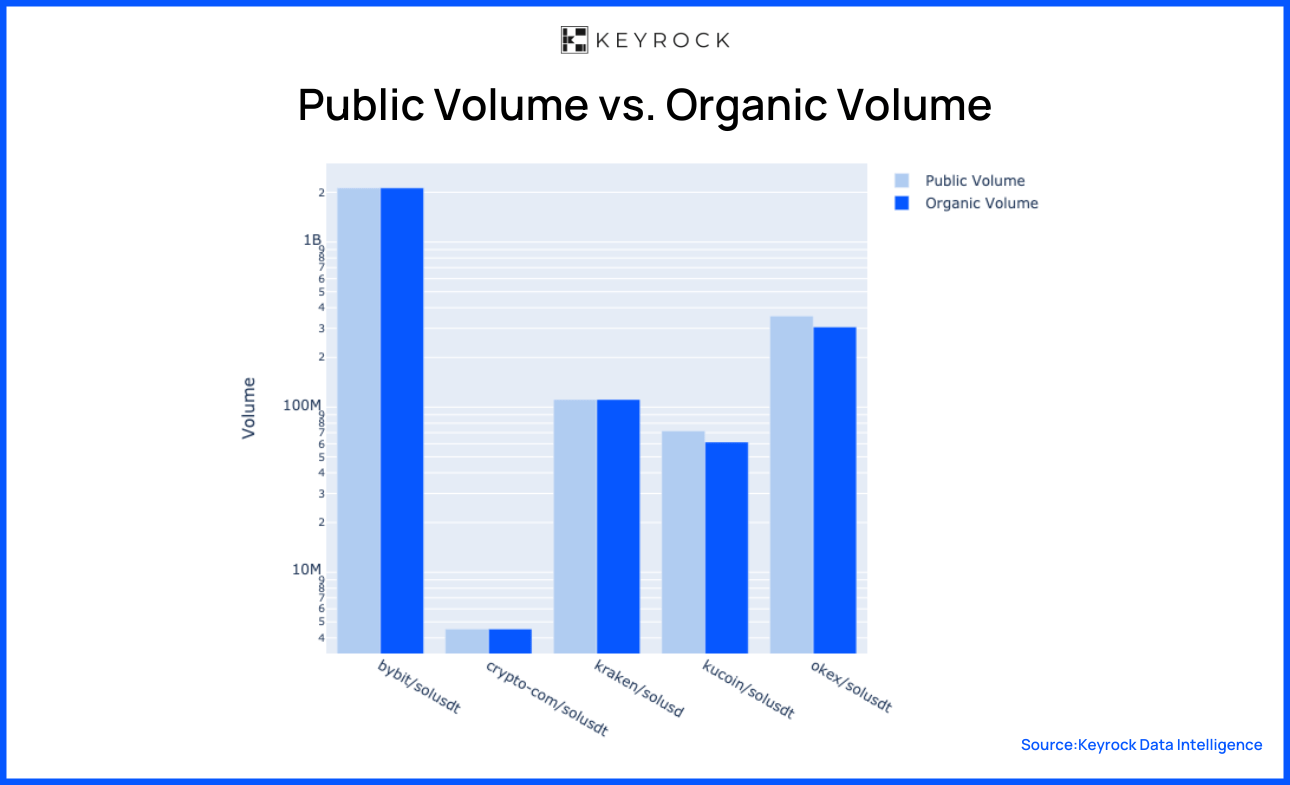
In our SOL/USDT market analysis, we discovered that over 90% of the volume recorded in a single day was organic. This reflects SOL’s market maturity, the competitive landscape among market makers, and the stringent compliance standards enforced by exchanges. These factors contribute to a robust and liquid market.

Note: Y-axis as in log scale.
Our analysis of wash trading allows us to ascertain a market’s true liquidity. Remember, a sign of wash trading is high volume coupled with low liquidity.
A very high-volume market is anticipated to have a similar or higher level of liquidity to support such activity.
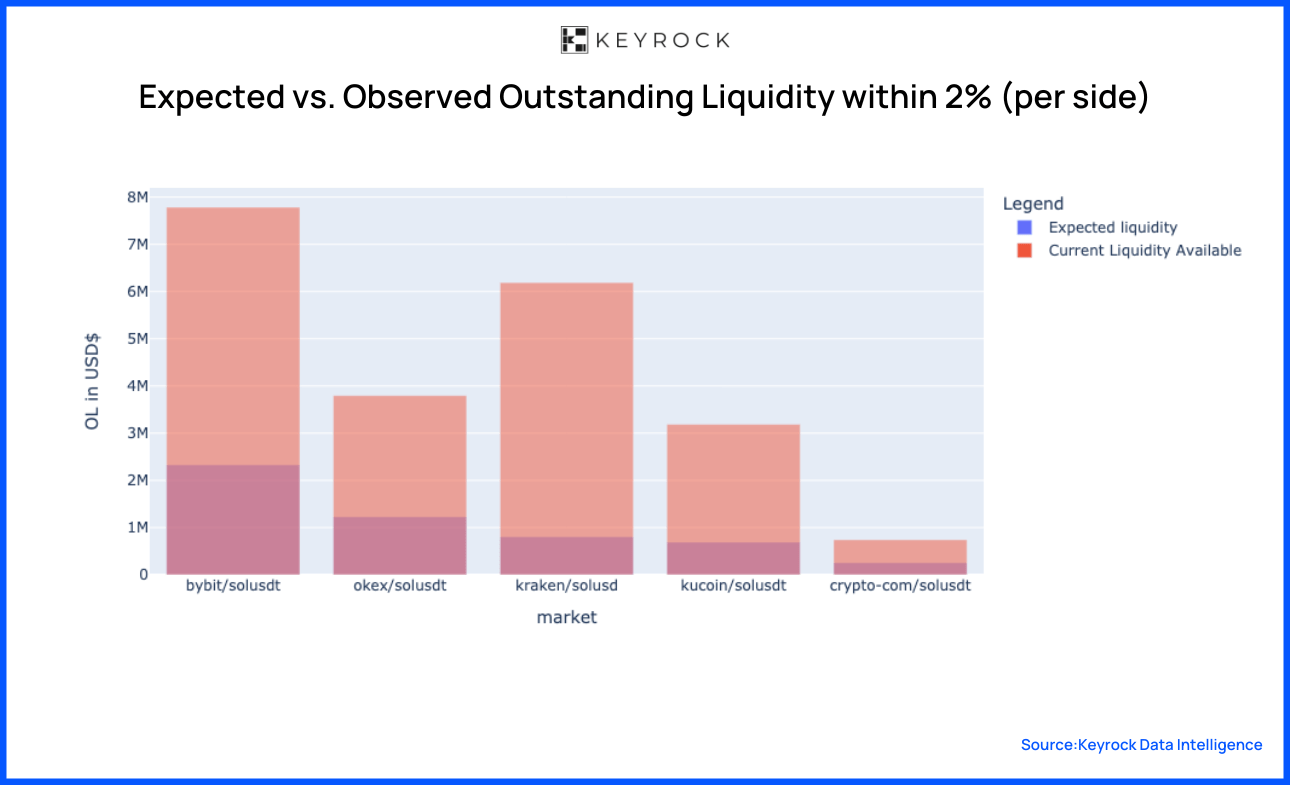
We define a market’s expected liquidity as the requisite funds needed to sustain the current volume of trading activity. A healthy market is characterised by a “Current Liquidity Available” that surpasses the “Expected Liquidity.”
This is the case when examining SOL/USDT markets.

It's not that simple
Wash trading involves artificially creating trading activity to simulate demand and inflate asset values, posing risks to market integrity and investor protection. However, measuring wash trading is not an easy task.
We have covered some of the key metrics we use. These include an ensemble of parameters to assess order book quality, volume quality, and trade quality. Together, these metrics offer insights into a market’s health.
Our analysis enables us to distinguish between organic and total volume on exchanges for specific markets. We also gauge the expected liquidity necessary to sustain daily trading activity. True market liquidity must match the volume to support healthy market activity, ensuring a fair and efficient trading environment.
We analysed the SOL/USDT market. Unsurprisingly, we found that 85% to 90% of the volume on SOL was organic, indicating market maturity and effective compliance at top-tier exchanges.
Read more: The slow birth of Bitcoin’s layered system: the Roots behind today’s L2 surge
- Looking for a liquidity partner? Get in touch
- For our announcements and everyday alpha: Follow us on Twitter
- To know our business more: Follow us on Linkedin
- To see our trade shows and off-site events: Subscribe to our Youtube

