

23 March 2026
Key Insights: To Kill a Rate Cut
Oil Locks the Rate Path
Every Monday, we deliver a concise yet comprehensive briefing to help you navigate the week ahead.
Our weekly market dashboard brings together key insights across Macro, Crypto, and Onchain activity, distilled into a clear, actionable format. Whether you’re managing risk or spotting opportunity, start the week informed and aligned.
Join our Telegram Channel to get it delivered directly to your phone.
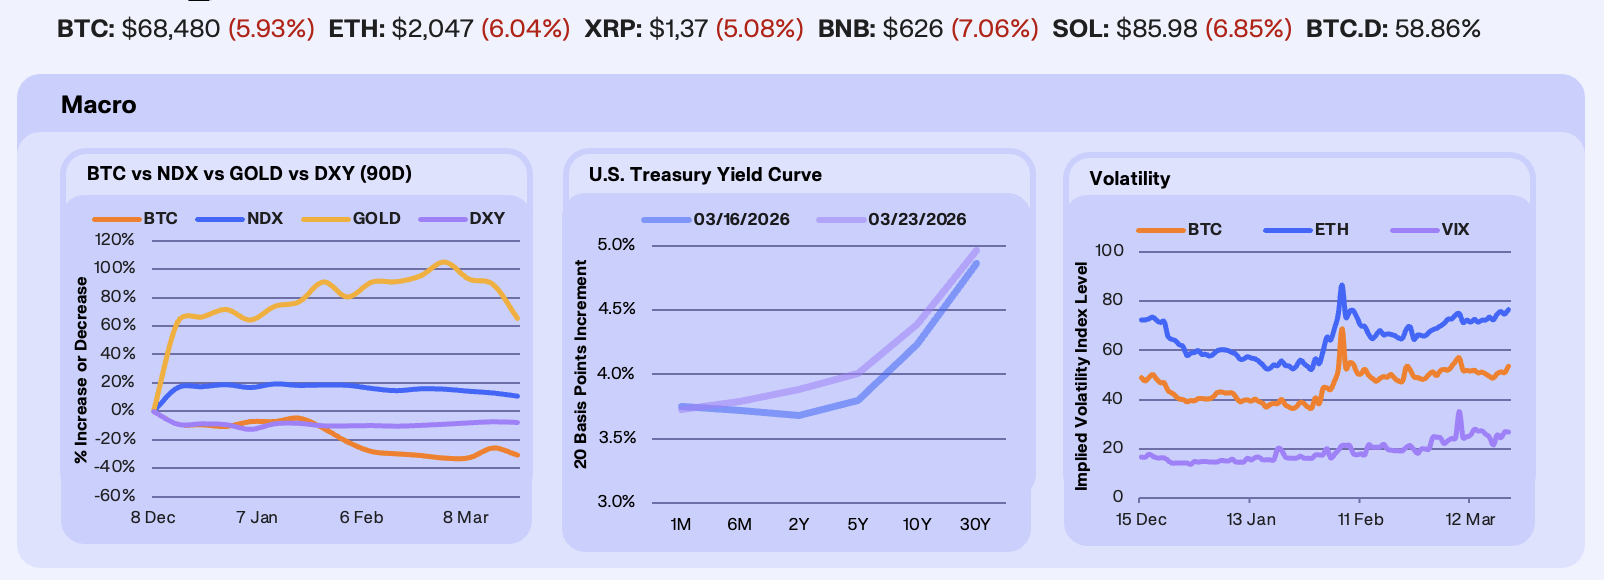
The Middle East conflict escalated sharply this week after Israel struck Iran’s South Pars gas field on March 18, prompting retaliatory missile fire on Qatar’s Ras Laffan facility, the world’s largest LNG export hub. Brent crude surged above $111 as tanker traffic through the Strait of Hormuz remained near a standstill, fewer than five daily transits against a historical average of 138. Gold collapsed -12.6% to $4,362, its longest losing streak since 2023, as the oil-driven inflation impulse lifted real yields and pushed rate-cut expectations to Q3. BTC fell -6.8% to $67,854, extending a post-FOMC selling pattern, NDX dropped -2% to and the DXY slipped -0.6%.
The Fed held rates at 3.50-3.75% on March 18, with only Governor Miran dissenting in favor of a cut. The dot plot maintained a median of one 25bp reduction for 2026, but seven of 19 participants now project no cuts at all, up from six in December. The Summary of Economic Projections raised the 2026 PCE inflation forecast from 2.4% to 2.7%, driven primarily by energy. Powell said inflation progress has been “slower than hoped” and signaled the committee cannot treat energy-driven price pressures as transitory while tariff-related inflation persists. February PPI, released the morning of the decision, reinforced the hawkish tone at +0.7% MoM against +0.3% expected. Treasury yields rose across the curve, led by the belly with the 2Y up +20 bps and 5Y +21 bps, while the 10Y added +16 bps and the 30Y +10 bps, as markets repriced the first expected cut to September at the earliest.
Volatility reversed course after compressing into the FOMC decision. BTC 30-day ATM implied volatility bottomed at 48.75 on the 18th before climbing steadily to 53.48 by Saturday (+6.28% WoW). ETH IV followed the same trajectory, rising from 72.34 at the FOMC low to 76.47 (+5.84% WoW). The VIX dropped to 21.51 on Tuesday, spiked to 25.6 after Powell’s hawkish presser, faded briefly to 24.46 on Thursday, then ground higher to 26.78 (+3.48% WoW) as Trump’s weekend ultimatum added a fresh risk premium. The post-FOMC session saw a rush for protection with Deribit’s put-call ratio jumping to 1.34 on March 19. The March 27 quarterly expiry holds 42,820 BTC (~$3B) in open interest, roughly 36% of the total, with max pain pinned at $70,000.
Our Take: The Middle East energy shock is now the dominant macro variable. Brent above $100 has compressed rate-cut timing from mid-year to Q3, lifted real yields, and pressured every asset priced on monetary easing. Gold’s seven-session decline and BTC’s post-FOMC drop both trace to the same repricing. The orderly nature of crypto selling, with vol compressing even as spot fell 5%, suggests downside is maturing. Oil is the signal we’re watching. If Brent stabilizes, the March 27 expiry and its max pain at $70,000 could anchor BTC consolidation near current levels. If Brent pushes toward $120, rate cuts are effectively off the table for 2026.
ETH Takes the Hit
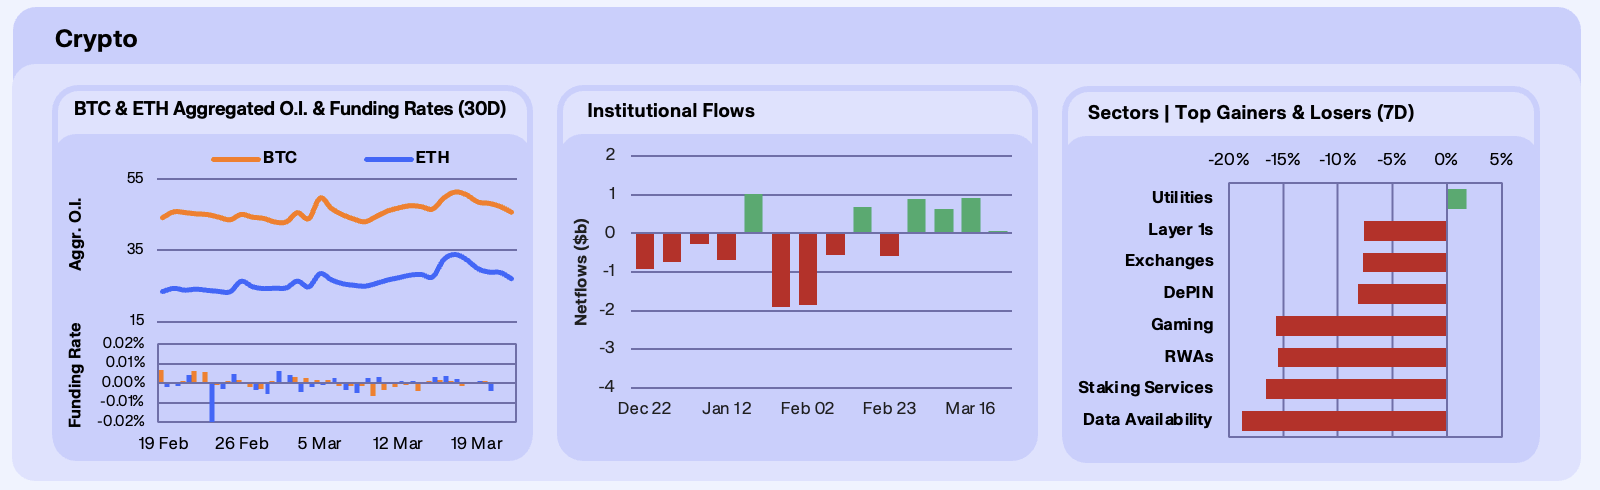
ETH open interest fell -16.60% WoW to $27.13B, more than double BTC’s -7.91% decline to $45.73B. Both assets closed with negative funding, a signal that short positioning outlasted the initial FOMC flush. BTC funding briefly flipped negative on the day of the decision before recovering by Friday. Over $200M in crypto positions were liquidated within four hours of the hawkish outcome. BTC had briefly touched $75,912 on March 17 in a derivatives-driven squeeze as traders closed bearish put hedges around $55K-$60K, forcing market-maker delta hedging, but the move reversed within hours and set up the post-FOMC flush.
Institutional flows split along the BTC/ETH divide. BTC ETFs recorded +$53.1M in net inflows for the week, with the bulk concentrated early before reversing post-FOMC. The average BTC ETF holder cost basis sits near $80,000, now roughly 18% above spot at $67,854, meaning the institutional cohort is accumulating deeper into unrealized losses.
Sector performance was uniformly negative outside of Utilities (+1.8%), the only category in the green. Chainlink anchored the resilience, benefiting from its Clean 16 commodity classification and growing institutional access through the recently launched Grayscale GLNK and Bitwise CLNK ETFs. Data Availability (-18.8%) led losses as speculative infrastructure plays like Celestia bore the full weight drawdown. Staking Services fell -16.6%, mirroring ETH’s OI collapse, with Lido’s share of staked ETH dropping to a year-to-date low of 22.82% on continued net withdrawals. RWA tokens declined -15.5% even as the underlying protocols posted inflows, detailed in Onchain.
Our Take: The ETH/BTC divergence widened across every metric this week. ETH OI fell more than twice as fast as BTC’s, ETH ETF flows flipped negative while BTC held positive, and both assets ended with negative funding. BTC’s relative resilience traces to institutional flows, with ETF buyers accumulating despite the -6.82% spot decline even as their average cost basis stretched to 18% above current price. Across sectors, only Utilities held up on regulatory clarity while rate-sensitive and ETH-adjacent plays absorbed the worst losses. If ETH funding normalizes and outflows stabilize, the deleveraging may be near exhaustion. The ETH/BTC ratio remains the confirmation signal.
Onchain Rates Trace the FOMC Cycle
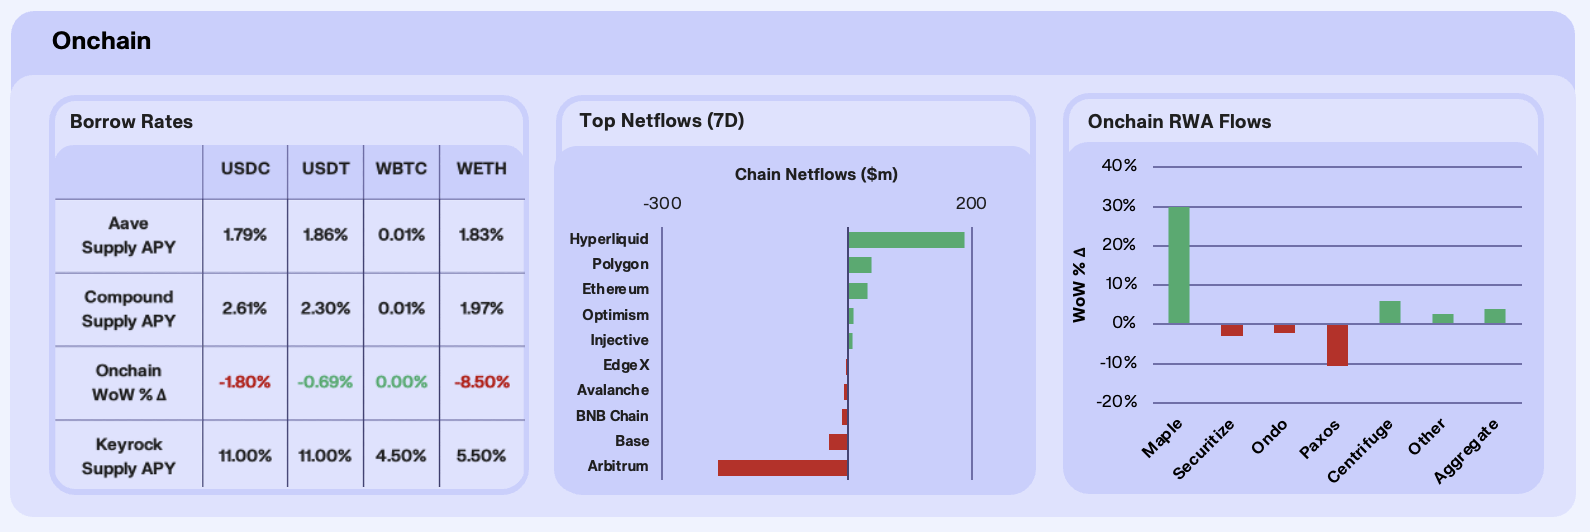
Stablecoin lending rates spiked sharply into the March 18 FOMC decision before fading through the rest of the week. USDT supply APY surged from 1.74% on March 16 to 2.59% on the 18th as leverage demand built while BTC pushed toward $76,000. The rate collapsed just as fast, falling to 2.00% by the 20th and settling at 1.80% by Saturday (+0.6% WoW net). USDC followed a steadier path, rising from 1.88% to 2.10% and holding above 2% through week end (+5.7% WoW). WETH supply APY declined -7% to 1.65%, tracking the ETH de-risking detailed in Crypto section, while WBTC held flat at effectively zero.
Cross-chain flows were more muted than recent weeks. Hyperliquid led inflows at +$189M, fueled by continued oil perps demand as Brent held above $111. Polygon added +$38.5M and Ethereum absorbed +$31.2M, a notable step down from recent weeks. Arbitrum recorded -$211M in net outflows, the week’s largest. Base lost -$31.3M and BNB Chain shed -$9.7M, extending its multi-week structural decline.
Tokenized asset AUM rose to $28.58B (+3.87% WoW) despite the risk-off backdrop. Maple dominated, surging +29.91% to $4.34B on continued institutional credit demand through its syrupUSDC and syrupUSDT vaults. Centrifuge added +5.84% to $1.44B. Securitize and Ondo recorded modest declines of -2.98% and -2.14% respectively, while Paxos saw the sharpest pullback at -10.71%.
Our Take: Capital concentrated on the trading layers this week, with Hyperliquid absorbing over $180M while stablecoin rates rose on pre-FOMC leverage before rolling over post-decision. Credit protocols like Maple posted inflows that rivaled treasury-linked Circle, suggesting institutional allocators treat onchain credit as a durable yield source even during risk-off weeks. The signal we’re watching is whether stablecoin rates sustain above 2% and Hyperliquid commodity flows hold beyond the acute oil spike.
75% of Crypto Is Now a Commodity
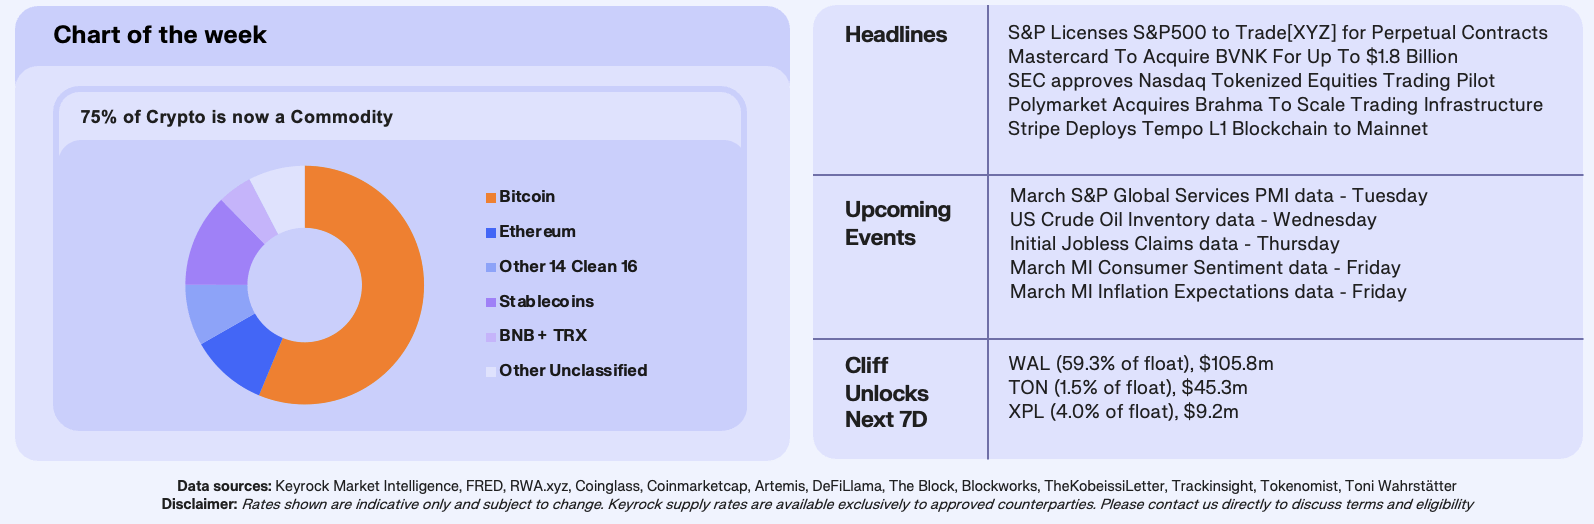
Crypto’s largest assets outside of Bitcoin have spent years without formal US classification, leaving institutional allocators, exchanges, and custody providers in legal ambiguity. On March 17, the SEC and CFTC jointly finalized a rule classifying 16 crypto assets as digital commodities. The list runs from established Layer 1s like Ethereum, Solana, and XRP to infrastructure protocols like Chainlink and Polkadot, extending to community-driven tokens like Dogecoin and Shiba Inu. Regulators drew the perimeter around market activity and network maturity rather than project origin or intent.
Bitcoin plus the Clean 16 now account for 75% of total crypto market capitalization, roughly $1.87T of a $2.49T market. Stablecoins, separately governed under the GENIUS Act, make up another 12.6% at $315B. That leaves just 12.3%, approximately $308B, without formal classification. BNB ($88B) and TRX ($29B) together represent over a third of that grey zone, and both carry exchange-linked structures that complicate commodity designation. The remaining ~$191B is distributed across roughly 18,000 smaller tokens.
Over 126 ETF applications currently reference assets on this list, and commodity classification removes the primary filing obstacle for each. CFTC-regulated derivatives on these tokens become straightforward to structure. Custody frameworks that previously required case-by-case legal opinions can now operate under a unified standard. For XRP, the ruling closes years of litigation uncertainty, and for Solana and Avalanche, both of which had faced SEC scrutiny, it removes a longstanding constraint on institutional participation.
Our Take: Three-quarters of crypto by market capitalization now sits inside a defined regulatory perimeter, with stablecoins separately governed under the GENIUS Act. The unclassified segment is shrinking, and the two largest assets remaining outside, BNB and TRX, both face structural questions around exchange-linked issuance that suggest a different classification path. The signal we’re watching is whether ETF filings for assets beyond BTC and ETH accelerate into the CFTC pipeline, and whether the 126+ pending applications translate into approvals within the year. If commodity classification becomes the default treatment for large-cap tokens, allocation models that previously capped crypto exposure at Bitcoin and Ethereum will need to expand.
Join our Telegram Channel to get it delivered directly to your phone.

Stay up to date
Get the latest industry insights, in-house research and Keyrock updates.
This site is protected by reCAPTCHA and the Google Privacy Policy and Terms of Service apply.