

The Liquidity Source That Leads Bitcoin
Written by Amir Hajian
Key Insights
- Bitcoin and global liquidity have historically shared 93% of their long-run price movement. Bitcoin’s price has moved in near-lockstep with global liquidity conditions, the strongest macro relationship of any major asset we tested.
- Bitcoin has historically been the most liquidity-sensitive asset in public markets. For every 1% change in global liquidity, Bitcoin has moved 7.6% over the following quarter. That is over 3x the NASDAQ.
- Bitcoin’s sensitivity to liquidity has fallen by roughly 23% since COVID. As spot ETFs, TradFi derivatives, and institutional allocators bring more price-insensitive capital into the market, Bitcoin’s sensitivity to liquidity is shrinking.
- It’s not the Fed, It’s the Treasury. Since 2021, Treasury bill issuance shows the strongest leading relationship with Bitcoin (r = +0.80, ~8 month lead), followed by Fed facility drawdowns (r = +0.54) and global liquidity (r =+0.26). Fed QE shows no statistically significant relationship.
- A $3-4 trillion annual refinancing wave is approaching. The US carries nearly $38 trillion in debt (121% of GDP) and a growing share matures through 2029. T-bill issuance remains the path of least resistance, the same channel that has preceded Bitcoin strength in recent cycles.
- The Treasury issuance cycle is in headwind territory, consistent with Bitcoin’s recent pain. As T-bill issuance picks up toward $600–800 billion annually from mid-2026, that impulse would be expected to feed through to Bitcoin by late 2026 / early 2027.
Introduction
Global liquidity has long provided a powerful framework for understanding asset price cycles. Expansions in liquidity and credit creation have historically coincided with rising risk assets, while contractions have tended to precede periods of financial stress. Assets perceived as stores of value have often been particularly sensitive to liquidity changes, as periods of monetary expansion are frequently associated with fiat debasement concerns.
Bitcoin has increasingly been positioned within this category. Despite its distinct structure, its major cycles have broadly aligned with changes in global liquidity conditions.
However, global liquidity measures obscure an important reality. Liquidity enters financial markets through multiple transmission channels that operate on different timelines and with varying intensity. The level of liquidity alone does not reveal which sources matter most for assets or how that impulse reaches different assets.
To examine Bitcoin’s relationship with liquidity more precisely, we constructed a global liquidity index that goes beyond any one central bank or any one country’s money supply. We tested its individual components against Bitcoin, alongside other liquidity sources that affect public markets. Our index captures three layers of the monetary system: Central bank balance sheets (the Fed, ECB, Bank of Japan, and People’s Bank of China), global broad money (M2 across the US, Europe, Japan, and China), and US private bank credit. For US liquidity, we use net liquidity, the Fed’s balance sheet minus Treasury cash reserves and reverse repo balances, because swings in these facilities can dominate the Fed’s balance sheet signal.
Together these total roughly $111 trillion. Because these layers interact, central bank operations flow through to credit and the components overlap, but the index is designed to capture the aggregate impulse across all three channels of transmission.
Three findings emerged in our analysis
First, Bitcoin is the most liquidity-sensitive asset in public markets. Historically, changes in global liquidity have translated into significantly larger moves in Bitcoin than in equities, credit, or commodities, with sensitivity multiples several times higher than traditional risk.
Second, the source of liquidity matters as much as its level. Since 2021, Treasury bill issuance and fiscal liquidity channels have shown the strongest leading relationship with Bitcoin, while traditional central bank balance sheet measures have exhibited a much weaker connection.
Third, the macro environment is approaching a structural inflection point. With trillions in U.S. federal debt outstanding and refinancing needs projected to accelerate sharply over the coming years, the liquidity channel that has influenced Bitcoin most in recent cycles is likely to expand again. The debt must be rolled, and how it is financed will shape the liquidity environment ahead.
The report proceeds in three parts:
- The Sensitivity — How Bitcoin has historically responded to global liquidity, and how that compares to other asset classes.
- The Divergence — Which liquidity sources show the strongest relationship with Bitcoin, and why gold tells a different story.
- The Outlook — The debt refinancing cycle and what it suggests for liquidity ahead.
The Sensitivity
Before comparing sensitivities across assets, we must first establish whether global liquidity has historically explained Bitcoin’s price movements at all.
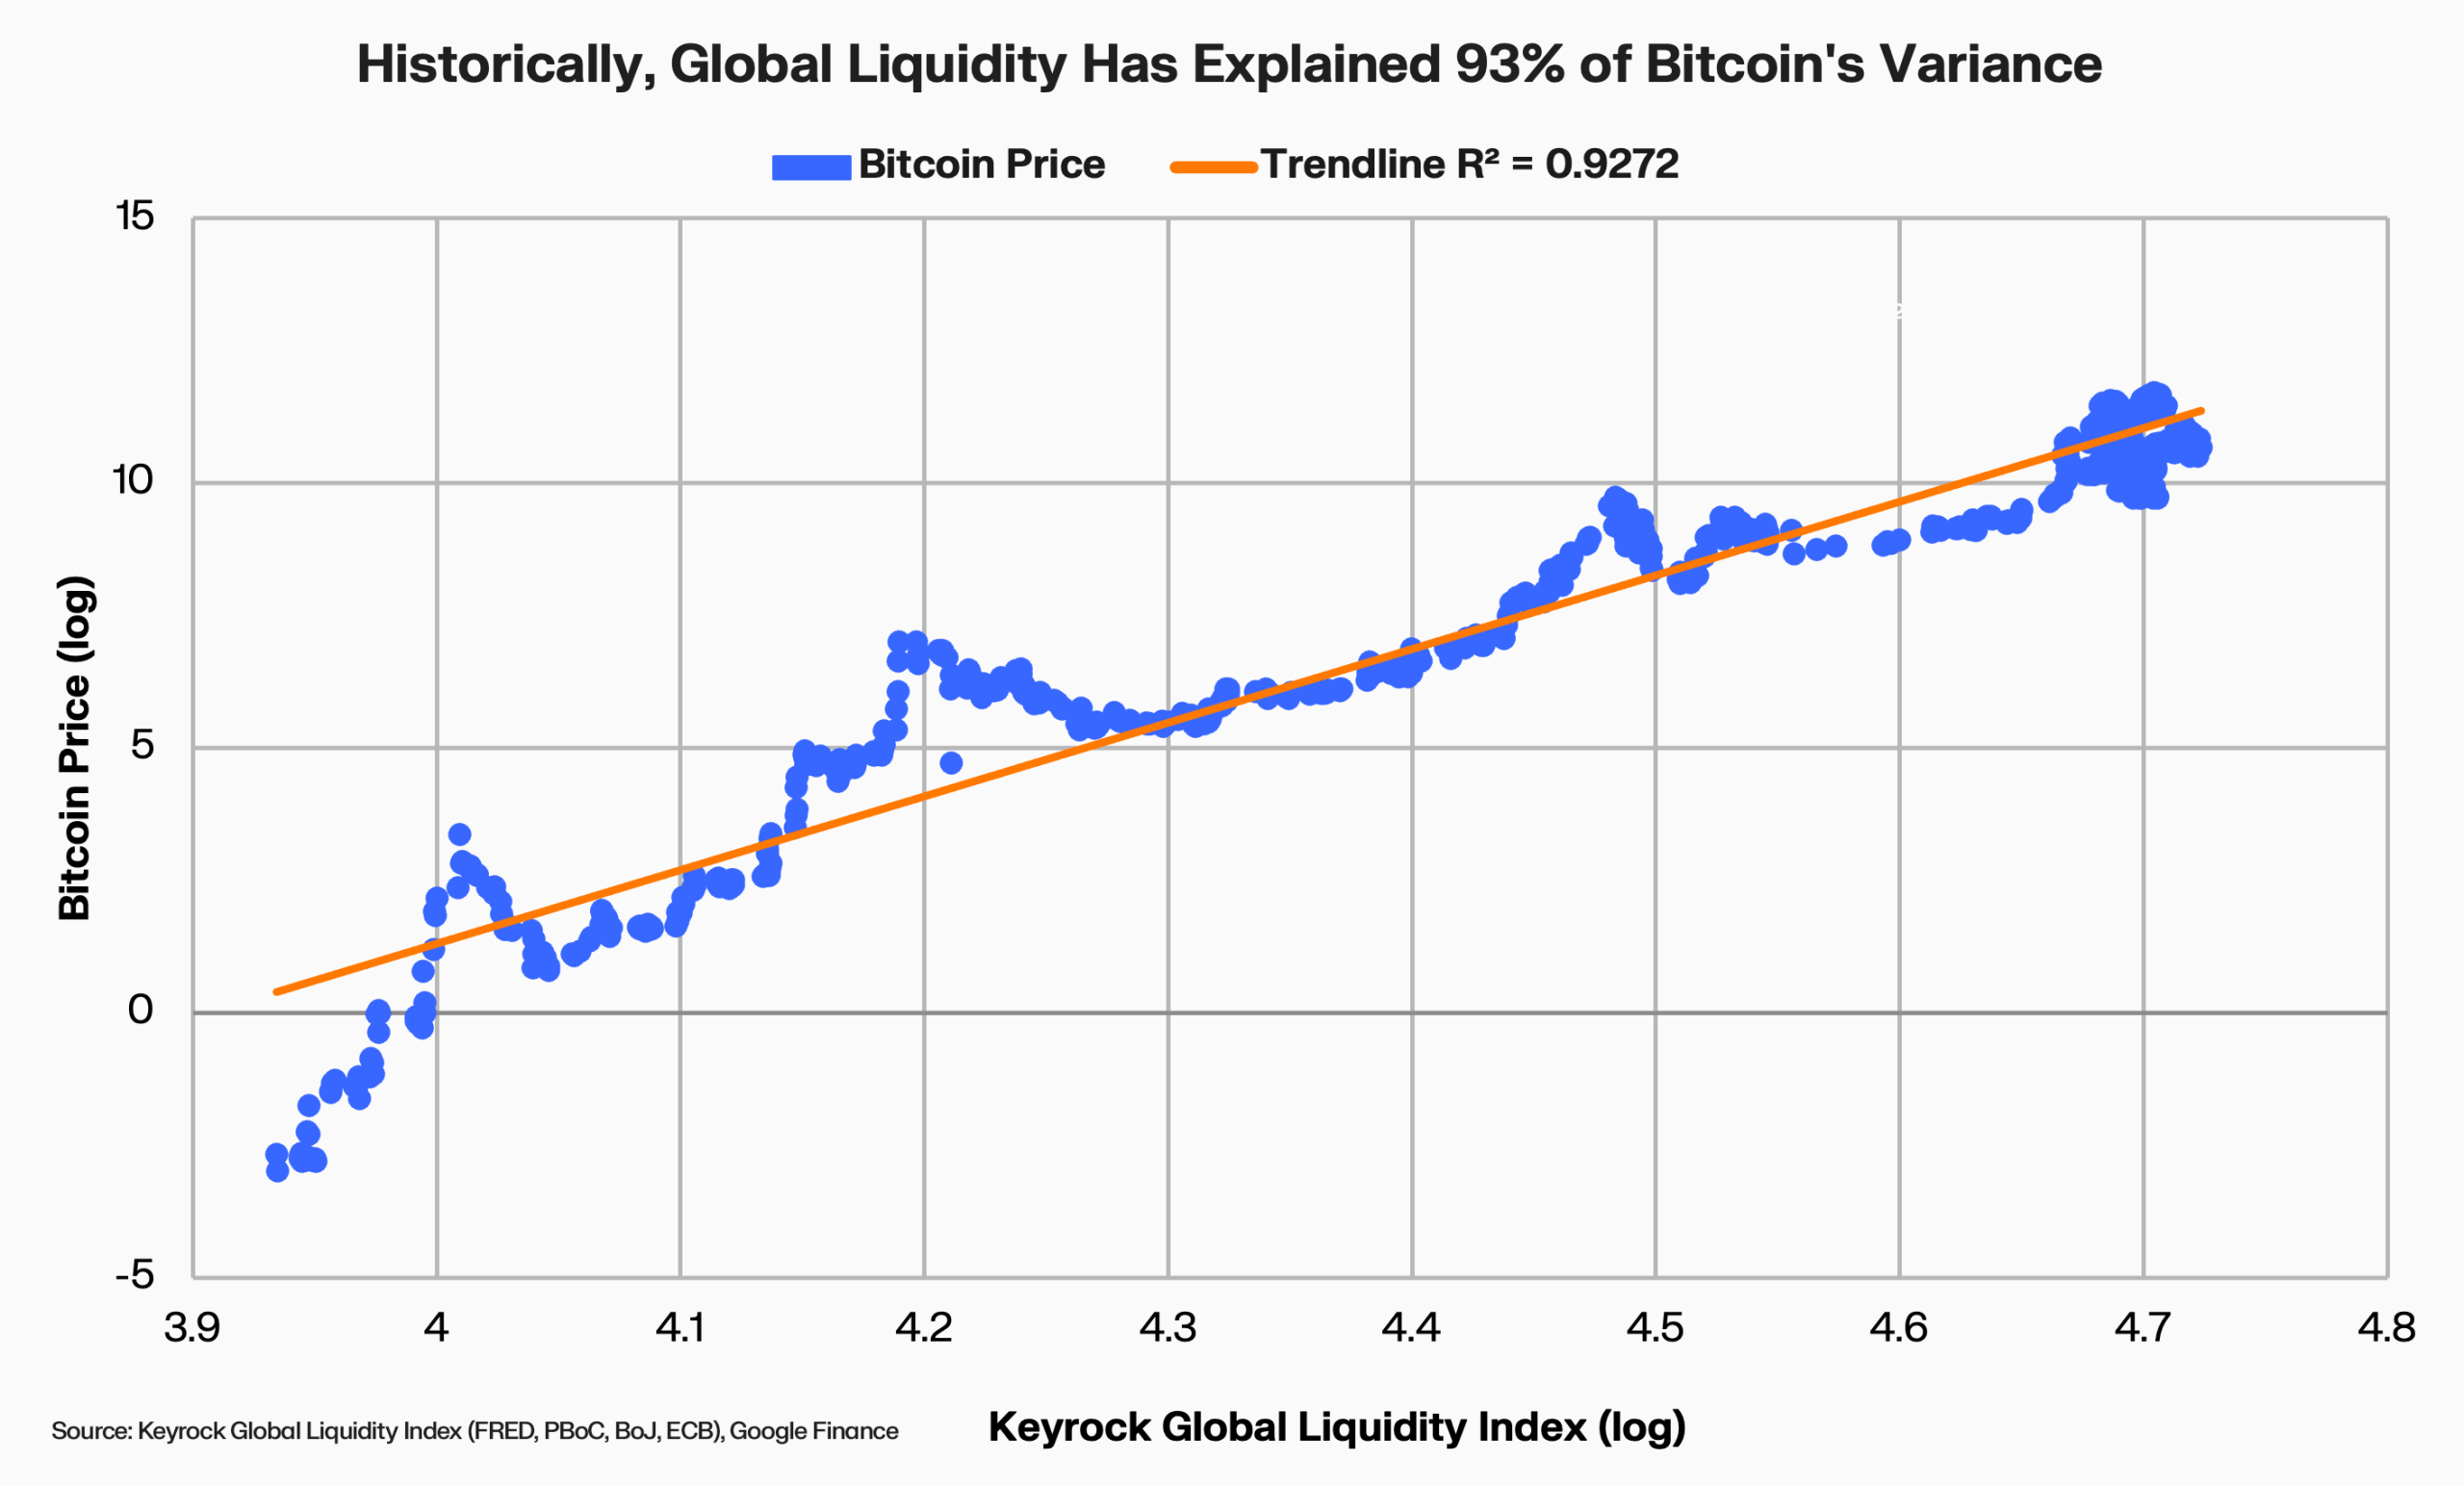
We compared Bitcoin’s price to our global liquidity index using weekly data from 2010 through early 2026. Over that period, the two have shared 93% of their long-run variance. Both Bitcoin and global liquidity have grown significantly since 2010, and some of that overlap simply reflects the fact that both trended higher. The 93% figure captures how closely they have moved in lockstep over 15 years, which is itself a meaningful observation but not standalone statistical proof that one drives the other.
Sentiment, narratives, exchange hacks, regulatory headlines, and halving cycles all shape shorter-term moves. But over quarters and years, the trajectory has historically tracked liquidity. The sensitivity analysis below strips out the shared trend and tests whether changes in liquidity have historically preceded changes in asset prices.
We compared Bitcoin’s price to our global liquidity index using weekly data from 2010 through early 2026, and measured how changes in liquidity have historically preceded changes in asset prices. Consistent with prior research, we applied a 13-week lead, meaning liquidity changes today are measured against asset price changes roughly three months later. Causality tests have shown that global liquidity has historically led risk-asset prices by roughly this interval, and our own data confirmed the strongest fit at 13 weeks.
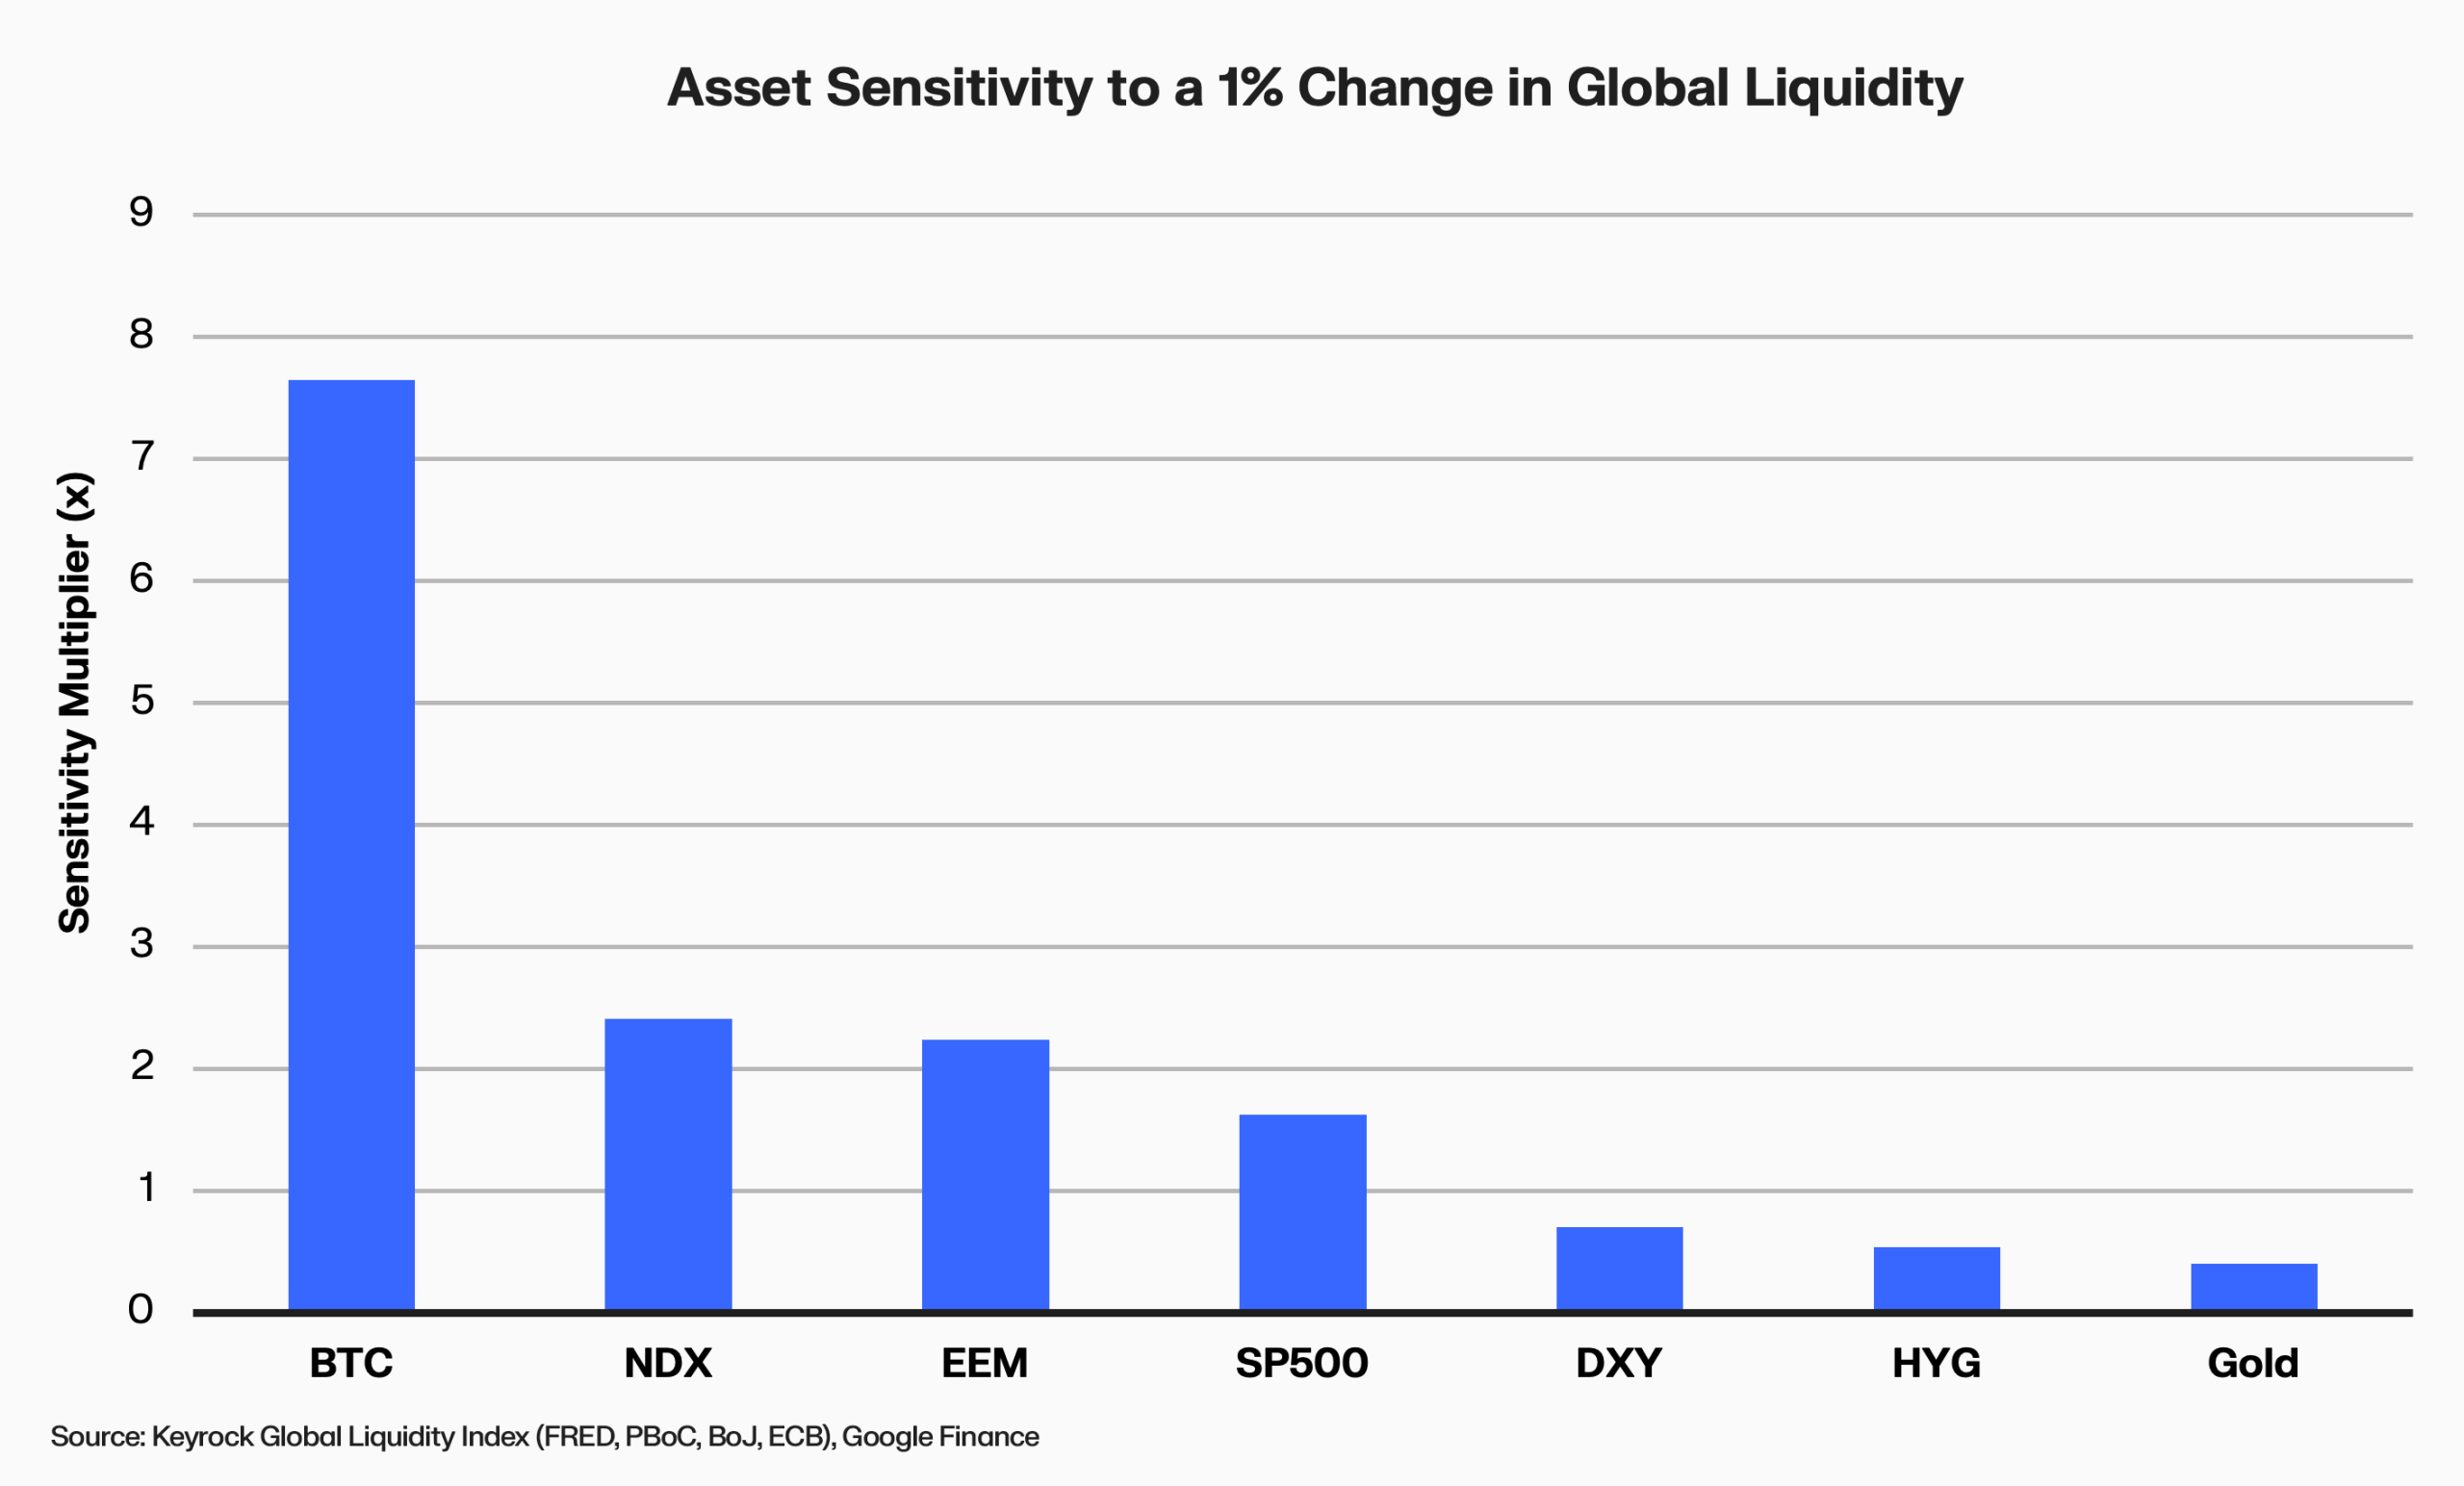
We found that historically, for every 1% change in global liquidity, Bitcoin has moved by 7.6% over the following quarter. The NASDAQ 100 has moved 2.4%. High yield credit has moved 0.5%. Gold has moved 0.4% The relationship has worked in both expansions and contractions. The gap between Bitcoin and the most sensitive equity (NASDAQ) is over 3x. No traditional asset comes close to the sensitivity that Bitcoin exhibits.
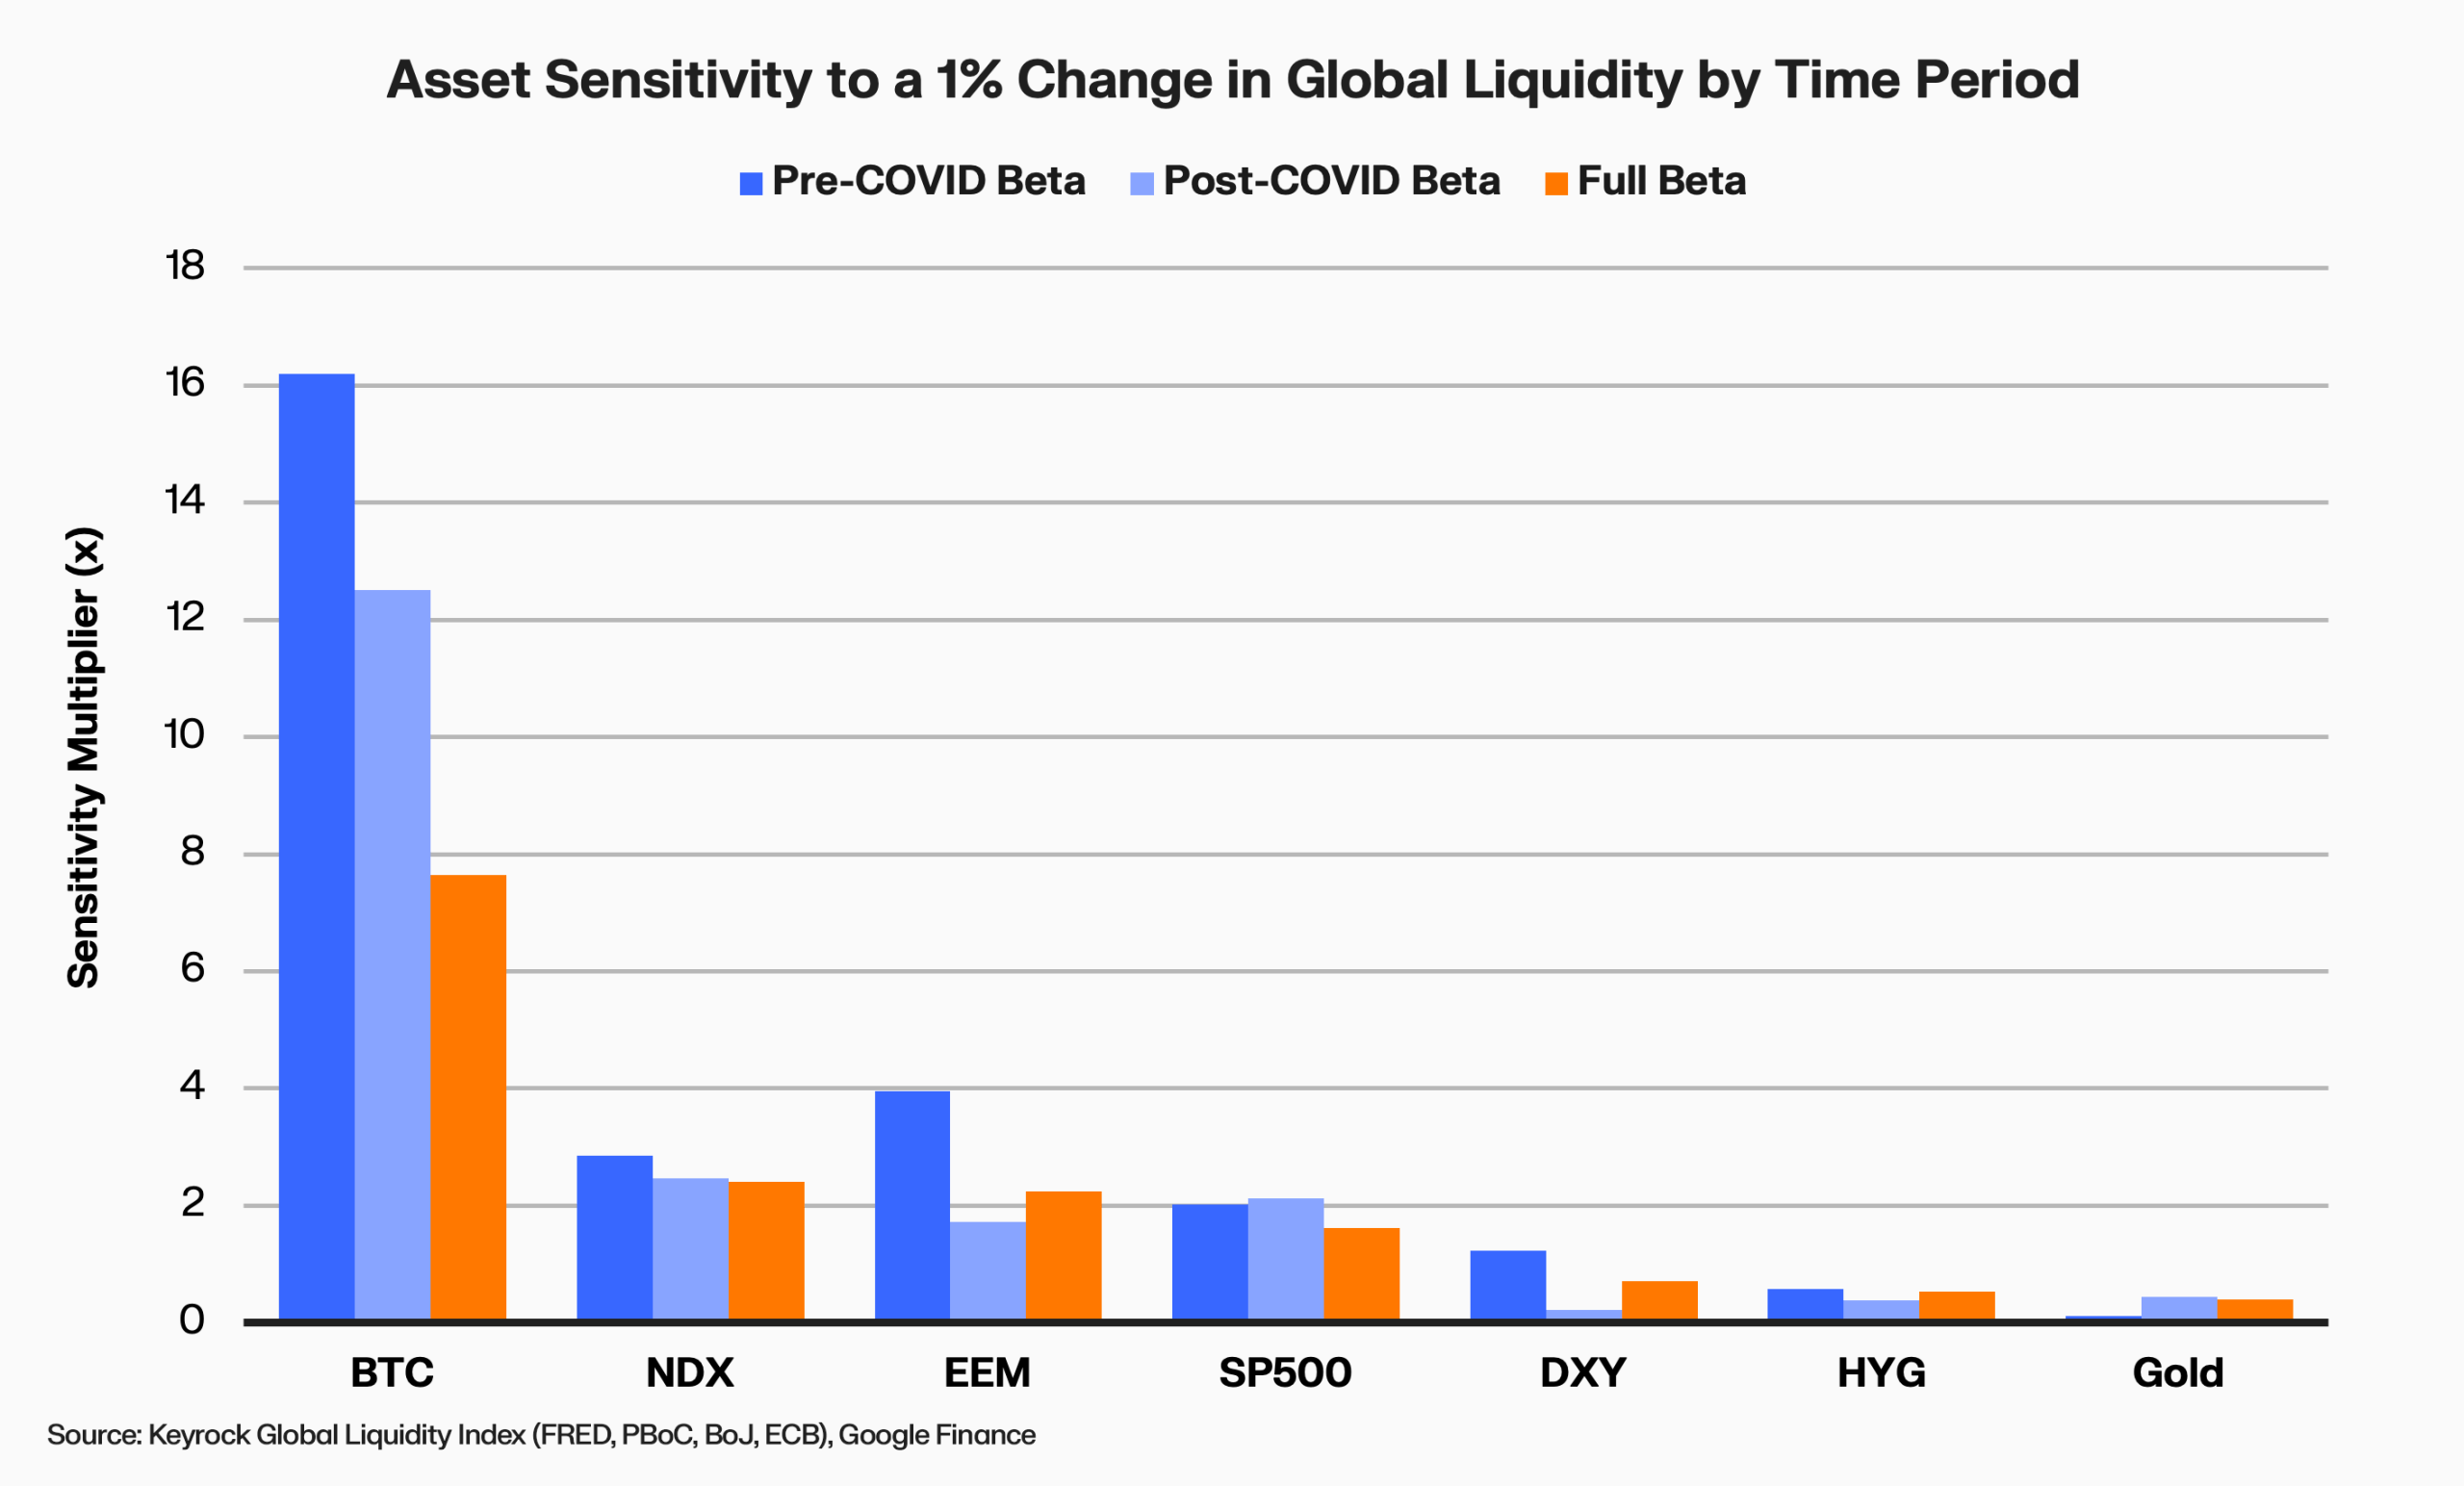
The sensitivity results are also robust across time. We tested three non-overlapping windows. Full period (2017-2026), post-COVID (2020-2026), and pre-COVID (2017-2020) and the ranking never changed. Bitcoin at the top, equities in the middle, the US dollar, credit, and gold at the bottom.
What has shifted, however, is the magnitude of sensitivity. Pre-COVID, before institutional adoption of BTC ETFs, Bitcoin multipliers were even higher. The arrival of spot ETFs and deeper institutional participation appears to have dampened Bitcoin’s sensitivity to liquidity, likely by adding a layer of more price-insensitive capital.
This relationship has persisted continuously. The chart below plots the 12-week percentage change of Bitcoin alongside global liquidity (lagged 13 weeks to reflect the transmission delay as explained in the beginning of this section). When liquidity swings, Bitcoin responds. Bitcoin routinely swings 5 to 10 times wider than equities for the same liquidity impulse.

Not every move aligns perfectly. The late-2017 rally was the ICO bubble, a retail-driven mania that predated institutional integration with macro liquidity. The mid-2021 drawdown coincided with China’s mining ban, a Bitcoin-specific shock that overrode the still-positive liquidity signal. These divergences are real, but they are the exceptions. Historically, the dominant pattern has been clear that when liquidity expands (2020 QE), Bitcoin surges; when it contracts (2022 QT), Bitcoin falls.
The nature of Bitcoin’s relationship with global liquidity has also tightened as adoption has widened. Before 2020, Bitcoin traded largely on crypto-native narratives, halving cycles, and retail speculation. Since then, institutional trading, ETF flows, and macro-aware allocators have integrated Bitcoin into the broader financial system.
Why does Bitcoin sit at the top? In the absence of earnings, cash flows, and physical backing, price is overwhelmingly shaped by the liquidity environment. When central banks expand, excess reserves enter the financial system, push down yields, raise risk appetite, and flow disproportionately into the assets most sensitive to monetary conditions. Bitcoin sits at the top of that chain.
However, aggregate global liquidity is a blunt instrument. When we tested Bitcoin against individual liquidity sources, including our aggregate index, the Fed’s balance sheet, Fed facility drawdowns, and Treasury bill issuance, each moved on a different timeline and with a different strength of relationship. One source dominated the others by a wide margin. Section 2 breaks this apart.
The Divergence
Bitcoin has recently diverged from aggregate global liquidity in ways that a single number cannot explain. If liquidity is a reliable framework, why the disconnect?
Our global liquidity index blends central bank balance sheets, money supply, and credit across multiple economies into one figure. Not all of it matters equally for Bitcoin. The US accounts for the largest share of global liquidity and, as the issuer of the world’s reserve currency, its policy decisions ripple through every dollar-denominated market. To understand what has historically driven Bitcoin, we tested it against individual US liquidity sources, both inside and outside our global index.
Which liquidity source matters for risk assets?
US liquidity does not enter the financial system through a single channel. The Fed’s balance sheet is the most commonly cited lever, but it is not the only one. The Treasury General Account (TGA) and the Fed’s Reverse Repo facility (RRP) act as liquidity drains when balances rise and liquidity injections when they fall, and can at times offset or amplify the liquidity signal coming from the Fed’s balance sheet. Treasury bill issuance is a separate channel entirely, when the government funds deficits with short-term bills.
We tested Bitcoin against all three, plus our global liquidity index as a baseline, using cross-correlations across a range of lags from 2021 onward. Because the point of liquidity entry influences how quickly it transmits to risk assets, we tested each component across multiple lead–lag horizons. Facility flows hit money markets directly, while Treasury bill issuance flows through the real economy first, implying a longer delay before it shows up in asset prices.
We chose 2021 as our baseline because it marked a structural shift in how the US funded its deficit, termed “Treasury QE.” Under Treasury Secretary Janet Yellen, the share of government debt funded through short-term bills rose sharply, from roughly 15% to over 22% by 2024. This made Treasury bill issuance a far more significant liquidity channel than it had been in prior cycles. We refer to the post-2021 reliance on T-bill financing as “Treasury QE,” because it has functioned as a liquidity impulse transmitted through fiscal spending.
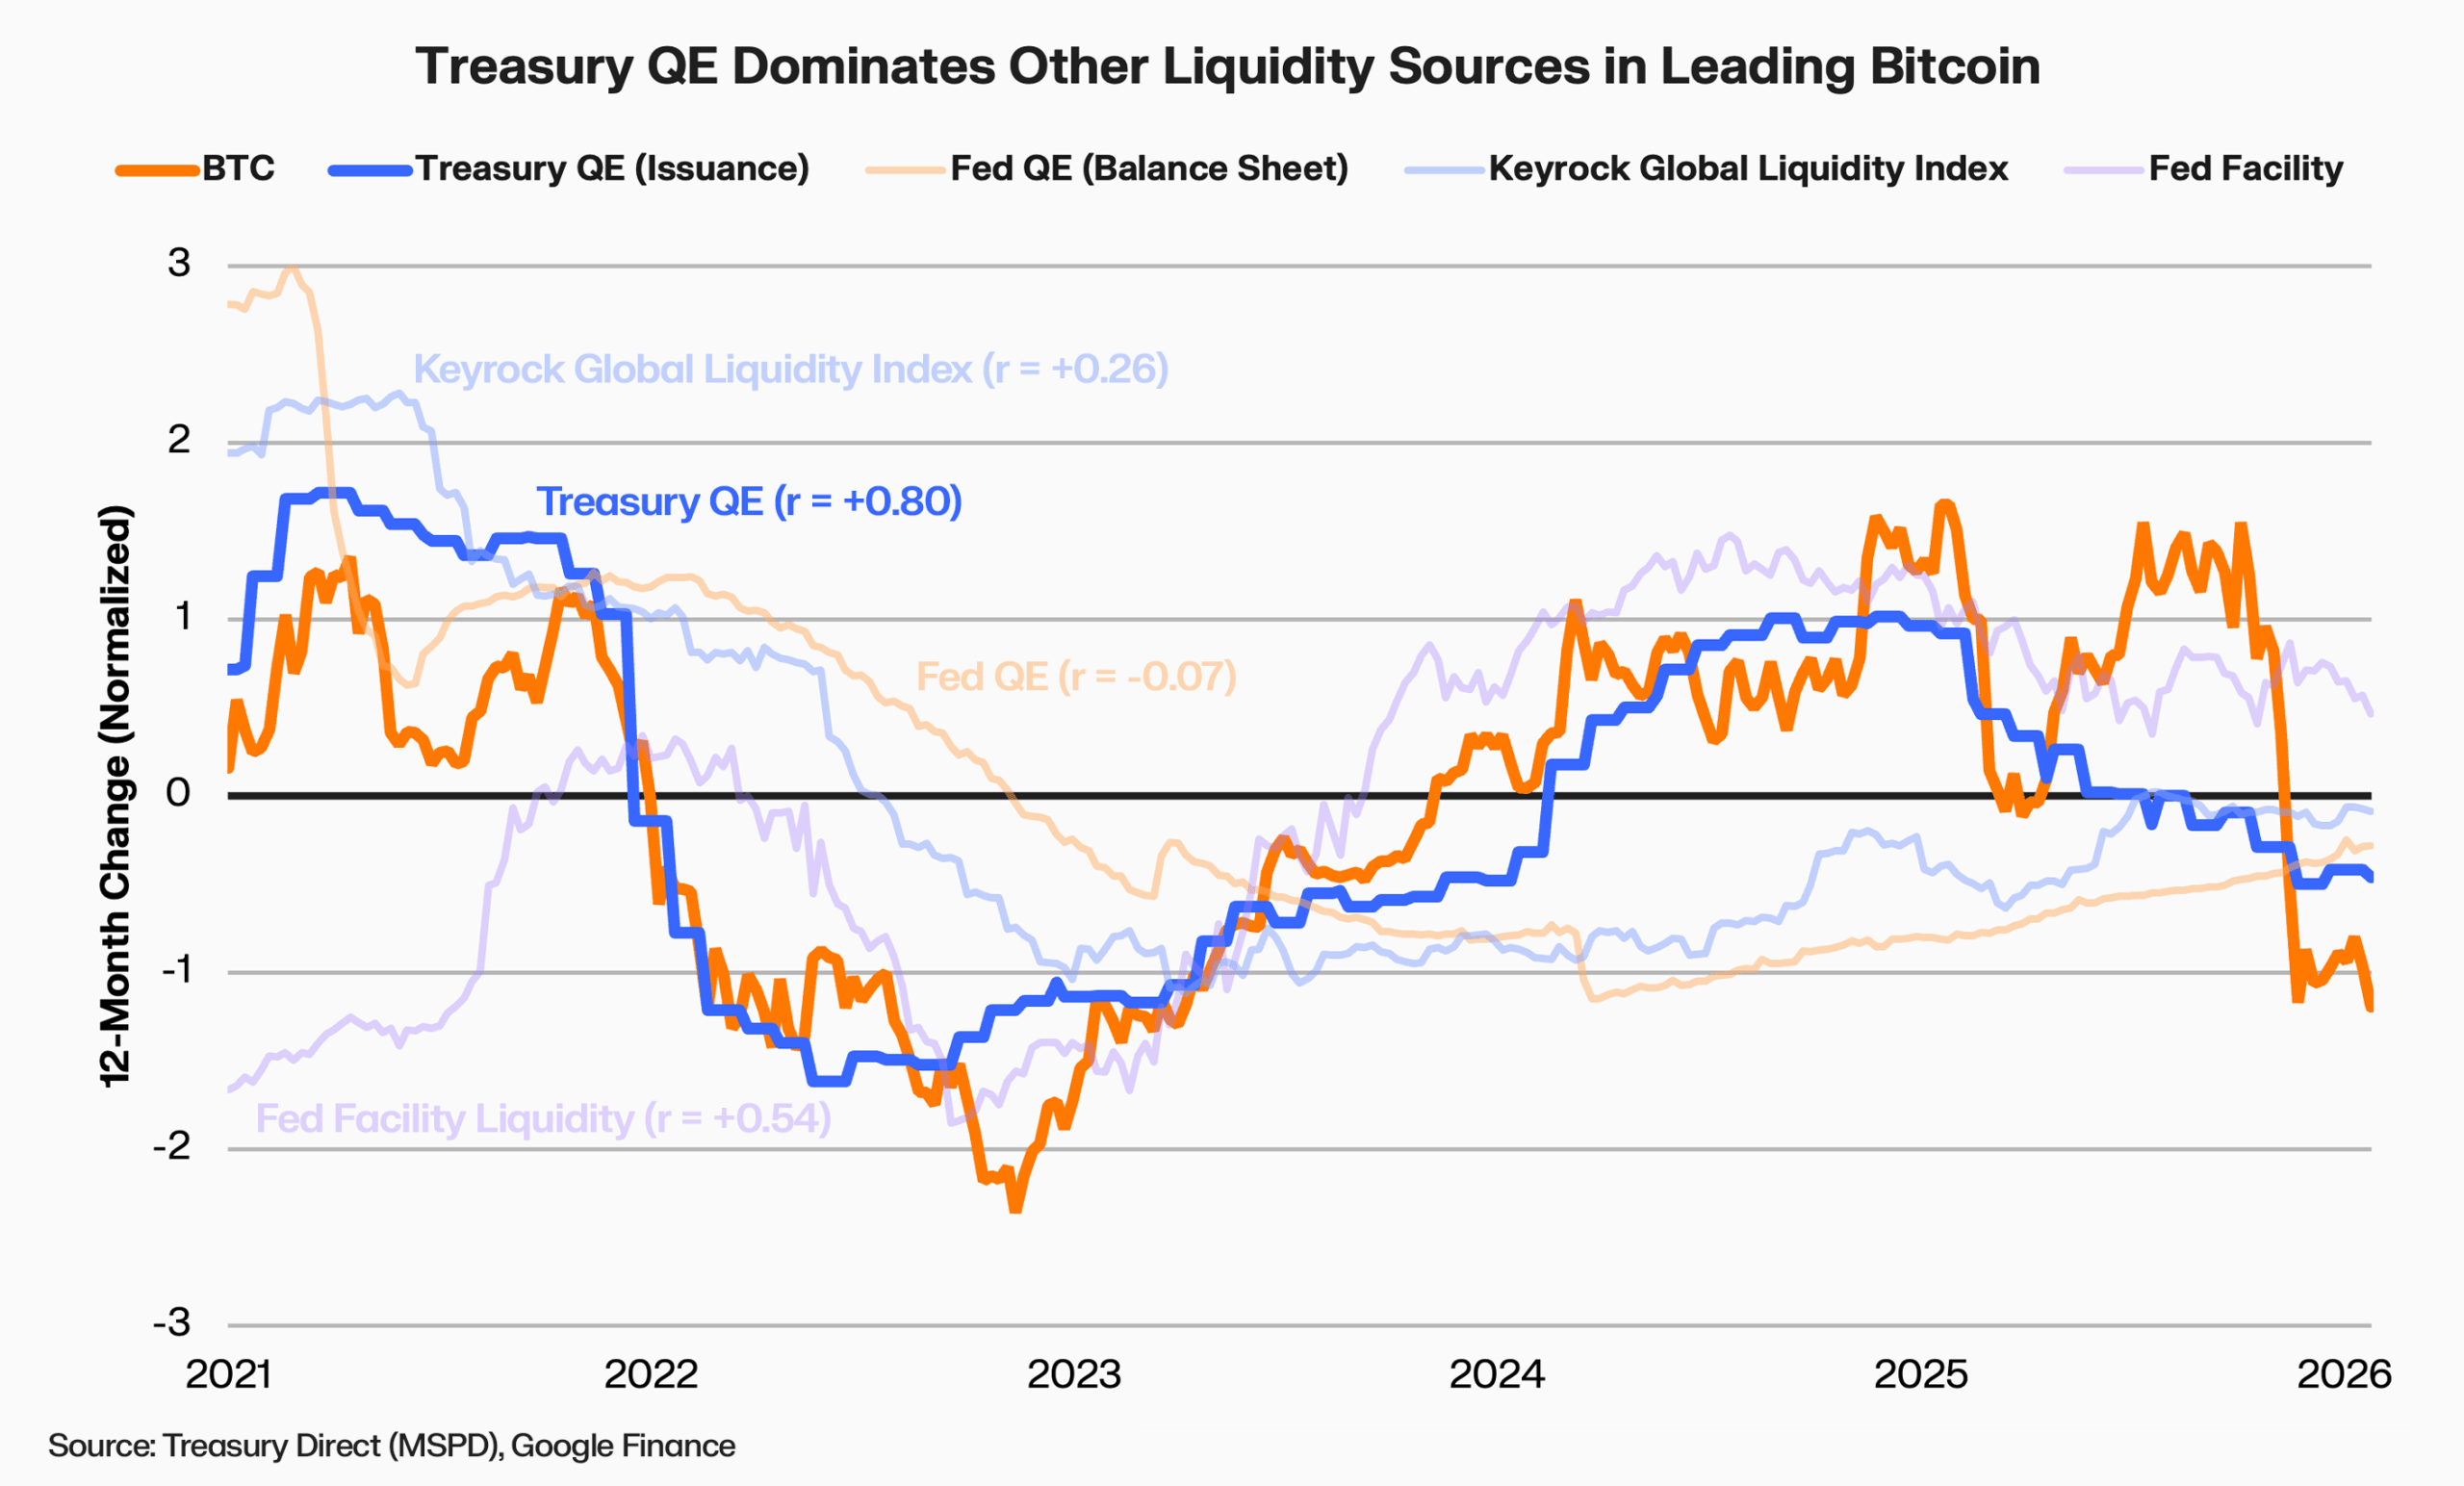
Since 2021, Treasury QE (T-bill issuance) shows the strongest leading relationship with Bitcoin (r = +0.80), followed by Fed facility drawdowns. The Fed’s balance sheet on its own shows no statistically significant relationship. The liquidity that has mattered for Bitcoin has been fiscal and facility-driven, not central bank purchases.
Bitcoin responds to Treasury QE
The conventional answer for what has historically shown the strongest relationship with Bitcoin is Fed QE. But as the data above shows, that answer is incomplete. The distinction matters because the two work through entirely different channels.
When the Treasury issues a T-bill, the buying bank pays using reserves at the Fed. Money market funds pay indirectly through their custodian banks or by shifting cash from the Fed’s reverse repo facility. Either way, those funds move into the Treasury’s account. For the buyer, this is an asset swap. No new money yet. The liquidity creation happens on the other side. When the Treasury spends those proceeds (government contracts, Social Security, defence), the money flows into recipient bank accounts as fresh deposits. The banking system as a whole now holds more deposits than before.
Long-term bonds work differently. When a pension fund buys a 10-year Treasury, it redirects money it already has. Existing savings move from one account to another. The liquidity impact depends on who purchases the bonds and how the proceeds are spent. When the Fed buys those same bonds, it does create new money, but that is traditional QE, not Treasury funding. T-bill issuance does not create new base money. Its liquidity impact depends on the funding source and subsequent Treasury spending.
In plain terms, when the Treasury ramps up T-bill issuance, it is financing spending that flows into the real economy, and eventually into risk assets like Bitcoin. When T-bill issuance falls or turns negative, that fiscal tailwind fades. The chart below tracks this relationship. Historically, rising net T-bill issuance has exhibited a leading statistical relationship with Bitcoin returns.
During COVID, T-bills outstanding surged by over $2.5 trillion as the Treasury funded emergency spending. Bitcoin rallied from $7,000 to over $60,000 over the following 18 months. Then came the reversal in 2021 as the Treasury paid down T-bills (net negative issuance exceeding $1.3 trillion) as it shifted to longer-duration debt. Bitcoin’s 2022 crash coincided with the exhaustion of this prior liquidity impulse. By 2024, modest positive issuance resumed, but the magnitude has been far smaller than the COVID surge.
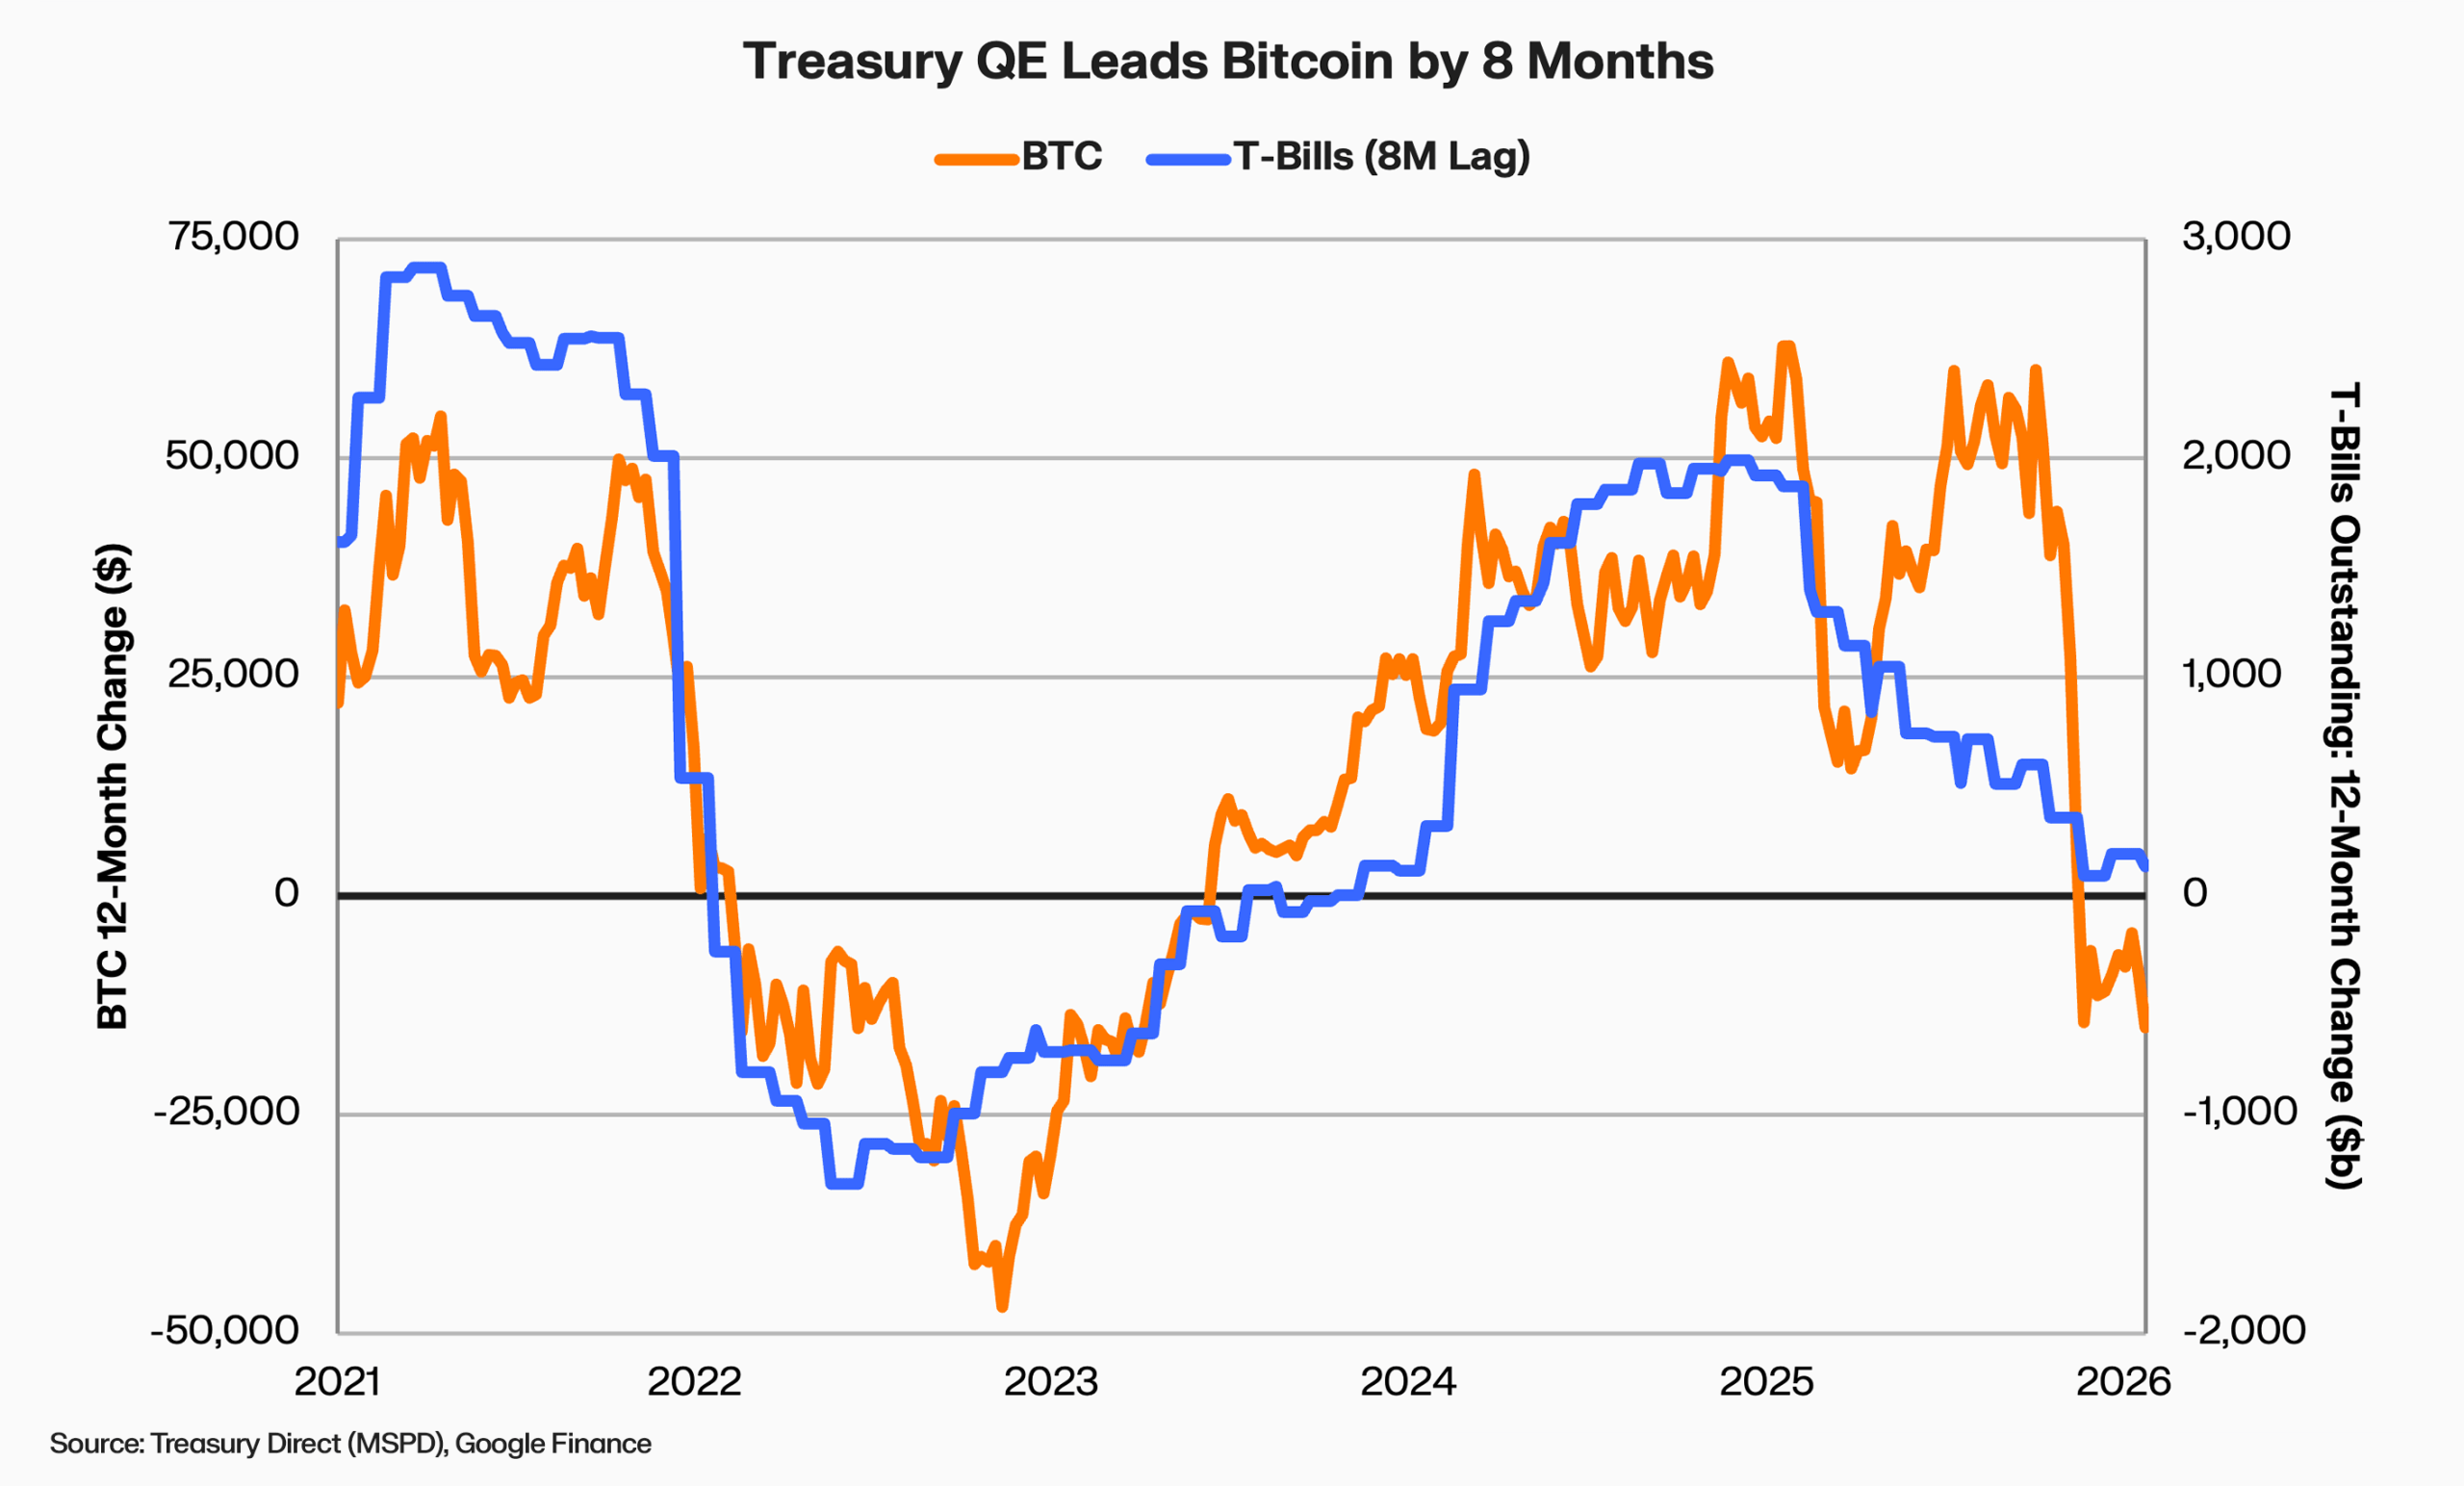
The roughly 8-month delay visible in the chart reflects how Treasury spending reaches markets. Fed QE floods the banking system with reserves and pushes down yields. It does create deposits when the Fed buys from non-bank investors, but those deposits come from asset swaps, not new income. The first-order effect is financial, not fiscal.
Treasury QE works differently as government spending lands directly in bank accounts as new income, and tends to reach financial markets with a longer lag as those deposits are saved, invested, or recycled through the economy. Granger causality tests are consistent with this, showing a statistically significant lead from Treasury QE to Bitcoin peaking around 9-16 months. Our cross-correlation analysis shows a similar lead of approximately 8 months.
Our global liquidity index blends liquidity sources that move on different timelines and transmit through different channels. For Bitcoin, the dominant source has recently been Treasury bill issuance.
The Outlook
The question now is timing. The US federal government carries nearly $38 trillion in debt, which is 124% of its GDP. Interest payments alone now exceed $1 trillion per year, consuming more than the entire defence budget. A growing share of that debt is coming due over the next three years.
How the Treasury chooses to refinance that wall of maturities, whether through short-term bills or long-term bonds, will shape the liquidity environment that has historically driven Bitcoin. Where are we in the liquidity cycle today, and what does the structural picture look like going forward?
A wall of debt is coming due
Before examining where we are in the cycle, we need to understand why liquidity expansion is not just possible but structurally likely. In our view, the answer lies in how U.S. government debt is structured.
The government is borrowing to fund new spending and it’s constantly refinancing old debt as it matures. This is how we got here:
- Borrow fast (2020): When COVID hit, the Treasury needed trillions quickly. Long-term bond markets couldn’t absorb that much supply overnight, so the Treasury leaned heavily on T-bills, which could be issued rapidly and absorbed easily by money market funds. During this period, T-bill share of total debt jumped from 14.5% to 23.7%. This was expedient, but it meant trillions would come due within months.
- Lock in low rates (2021-2022): With interest rates near zero, the Treasury saw an opportunity. It paid off maturing T-bills by issuing longer-term bonds at rock-bottom rates. 2-year, 5-year, 10-year, and beyond. T-bill share dropped back to 15.5%. This bought time, pushing refinancing needs into the future. The bars in those years went deeply negative (-$0.8T and -$1.2T), meaning less debt was coming due each year.
- The pivot (2023): As those rock-bottom rates expired and new issuance needed funding, the Treasury shifted back to T-bills. The share jumped from 15.5% back above 21% in a single year. Debt roll turned positive again (+$0.5T), ending two years of declining refinancing pressure.
- The wave arrives (2024-2029): The bonds issued in 2021-22 are now maturing. The Treasury may struggle to repeat the same strategy of locking in long-term funding at materially lower rates without significantly increasing interest expense. Demand for longer-duration issuance appears limited, as pension funds and insurers can only absorb so much supply without displacing other borrowers.. T-bills remain the most expedient option as money market funds hold over $8 trillion and constantly need short-term places to park cash.
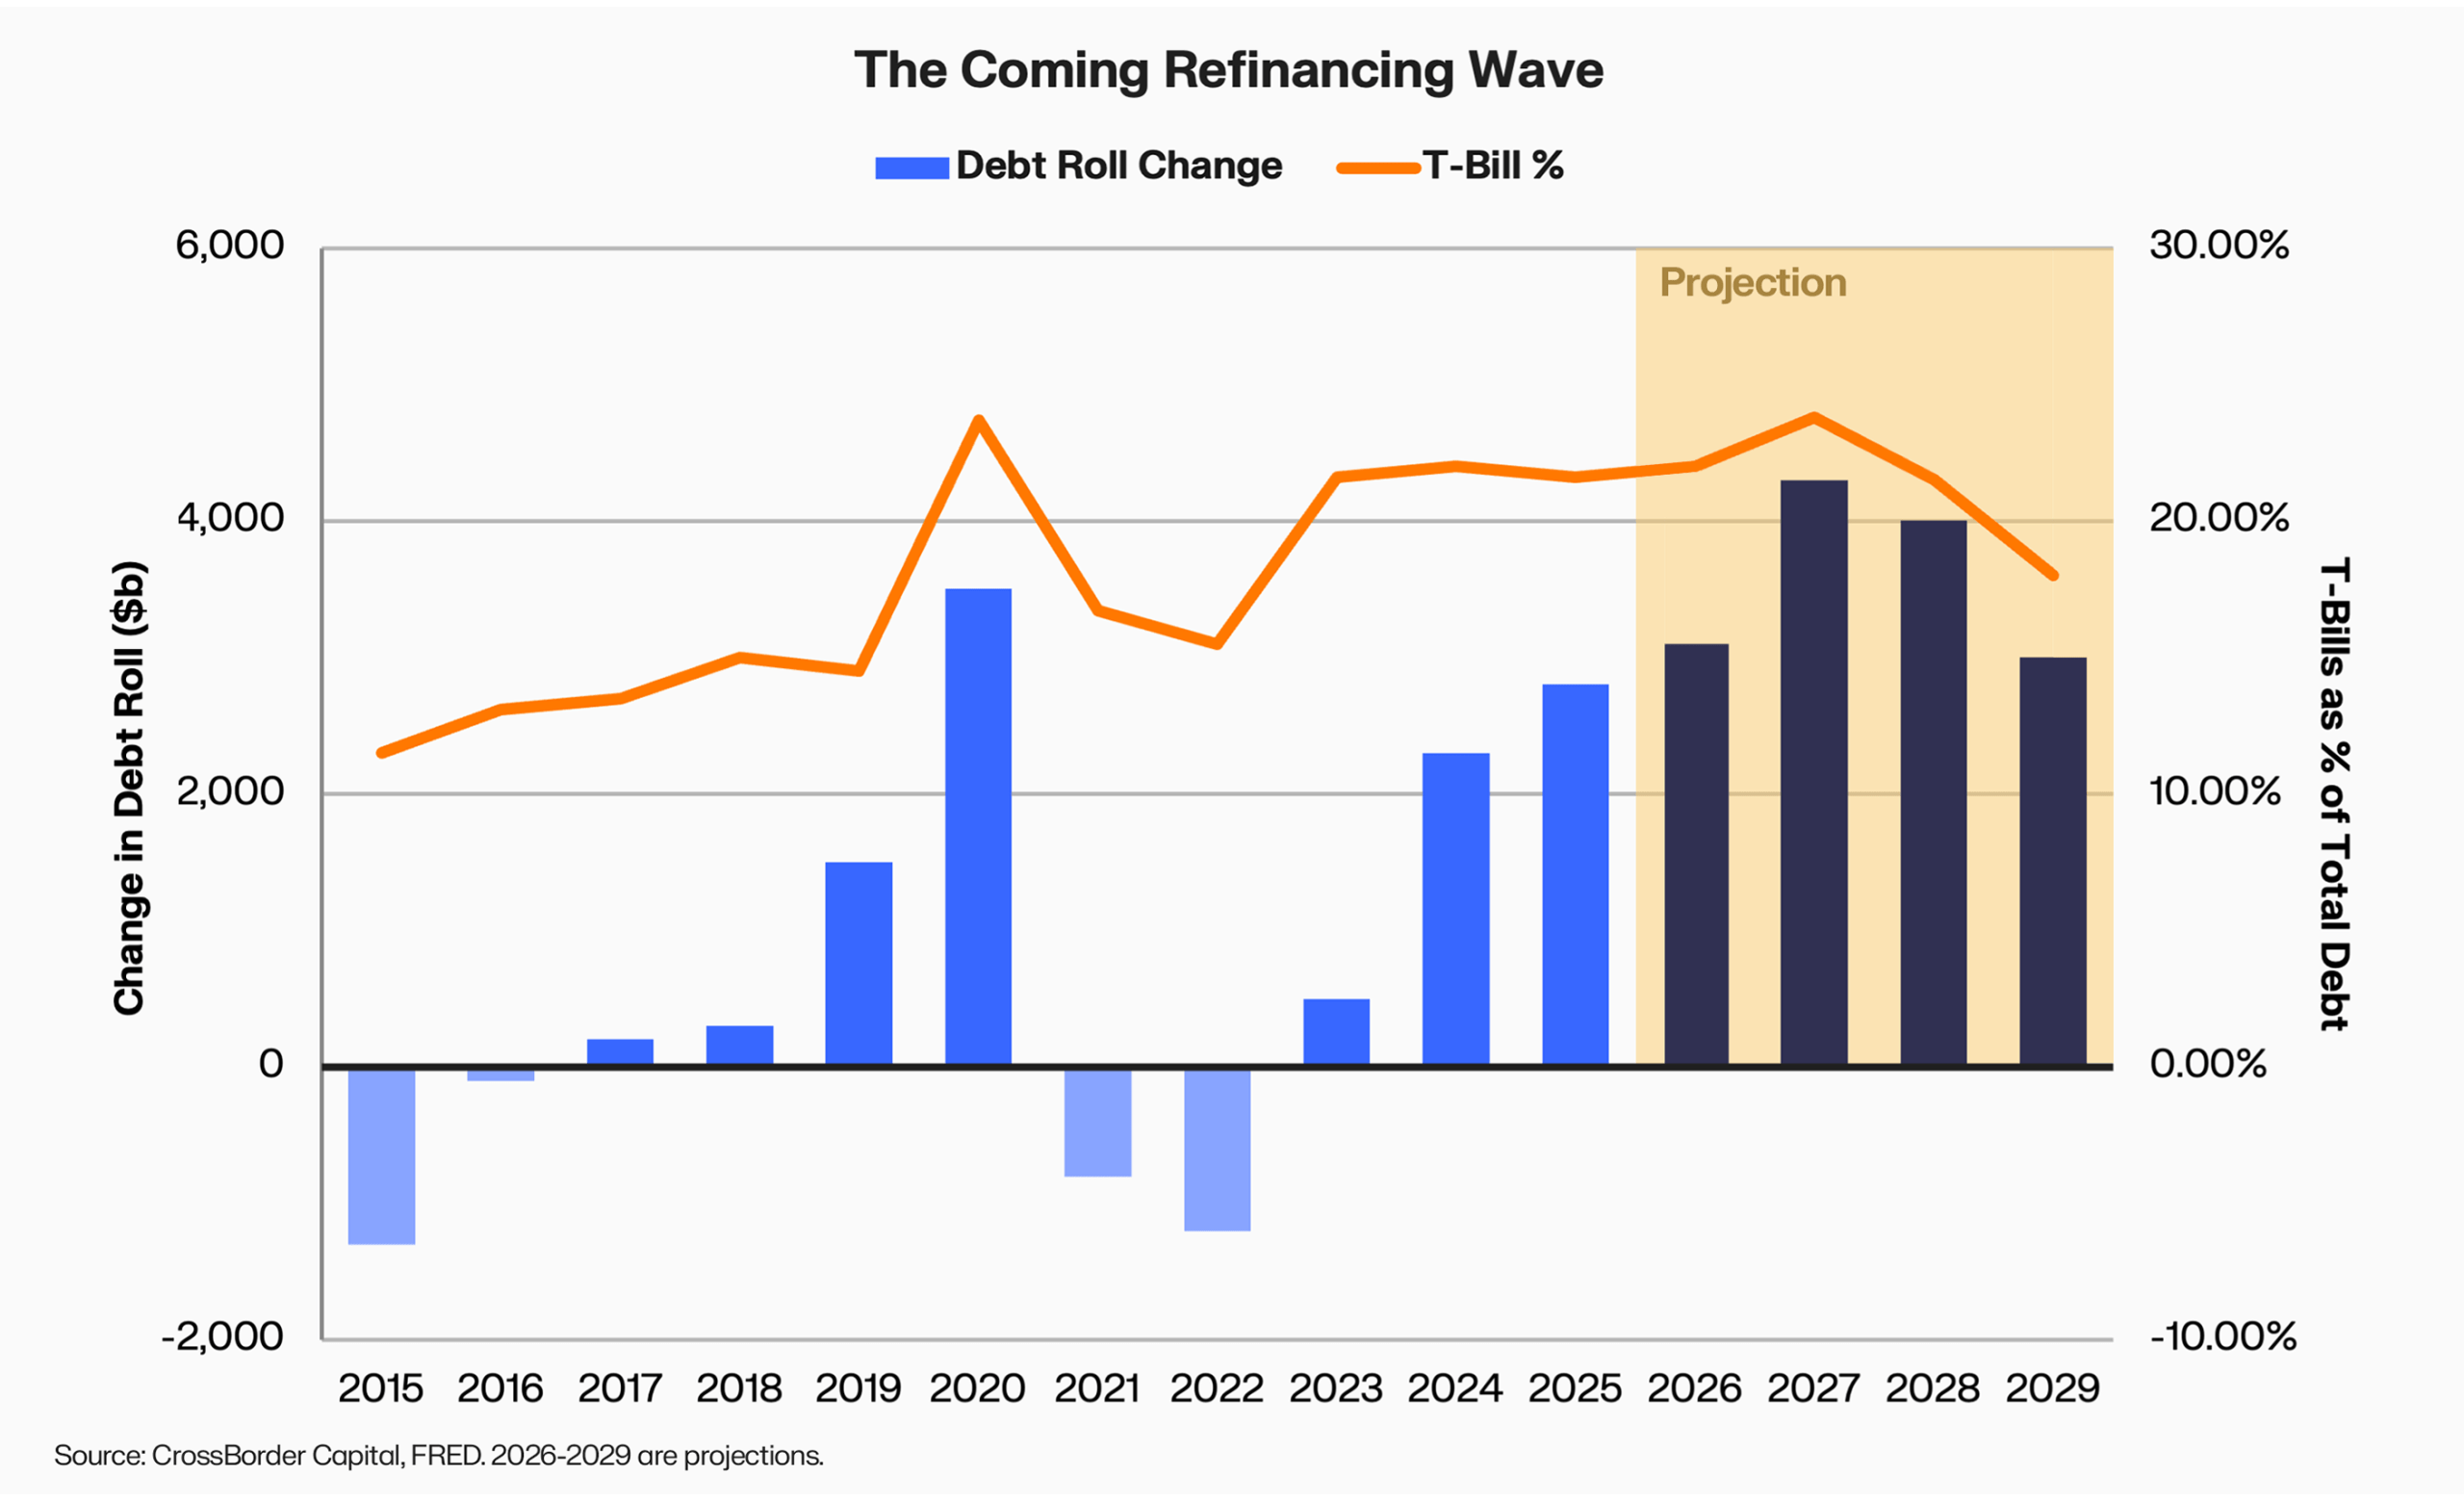
So the Treasury is back to relying on T-bills (now above 21% of debt), and the securities issued years ago are beginning to mature. Based on the current maturity structure and recent deficit trends, refinancing needs are projected to surge by $3–4 trillion per year through 2029.
The chart below captures this dynamic. The bars show how much more debt matures each year compared to the prior year. When positive, refinancing pressure is accelerating; when negative, Treasury has pushed maturities into the future. The line shows the share of total debt that is short-term (T-bills), which tracks how reliant the Treasury is on constantly-rolling short-term funding.
Why this tilts toward liquidity expansion
When trillions in debt mature, the Treasury must find buyers for trillions in new debt. There are three ways to do this:
- Sell long-term bonds to savers: Pension funds and insurance companies buy them using existing savings. This doesn’t create new money, it just redirects capital from one use to another. At a massive scale, this “crowds out” private investment and competes with corporate borrowing.
- Sell T-bills to banks and money funds. When money market funds buy T-bills using existing cash, the deposit-creation mechanism is weaker, but the Treasury still receives spendable funds that flow into the economy. Either way, T-bill issuance funded by short-term buyers puts money into circulation faster than long-term bond issuance. Section 2 called this “Treasury QE.”
- The Fed steps in: If private markets can’t absorb the supply, the Fed becomes the buyer of last resort. This is traditional QE.
In our view, Option 1 alone is unlikely to absorb the full scale of refinancing needs. Private balance sheets alone may struggle to absorb $3-4 trillion in additional long-term bonds each year without starving other borrowers. We believe Option 2 remains the most probable outcome given current money market balances and structural demand for short-term yield. If private absorption proves insufficient, Option 3 and renewed central bank intervention becomes increasingly likely, regardless of stated policy preferences.
When the government’s borrowing needs are this large, they effectively dictate monetary conditions. The Fed can set interest rates, but it can’t change the fact that trillions in debt need to be financed. And financing that debt through short-term issuance (T-bills) has historically expanded liquidity benefiting risk assets.
The issuance cycle has reset. The next wave is building
Given this structural backdrop, where are we in the issuance cycle? The chart below tracks net T-bill issuance impulse and our acceleration cycle (line) that measures whether that impulse is speeding up or slowing down.
Today, the lagged net issuance impulse reads approximately +$136 billion, well below the +$2,000 billion peak that preceded Bitcoin’s late-2024 highs. It has been declining since late 2024, consistent with Bitcoin’s recent weakness. On an unlagged basis, T-bills outstanding have grown by +$216 billion over the past 12 months, a modest positive that has not yet fed through the 8-month lag.
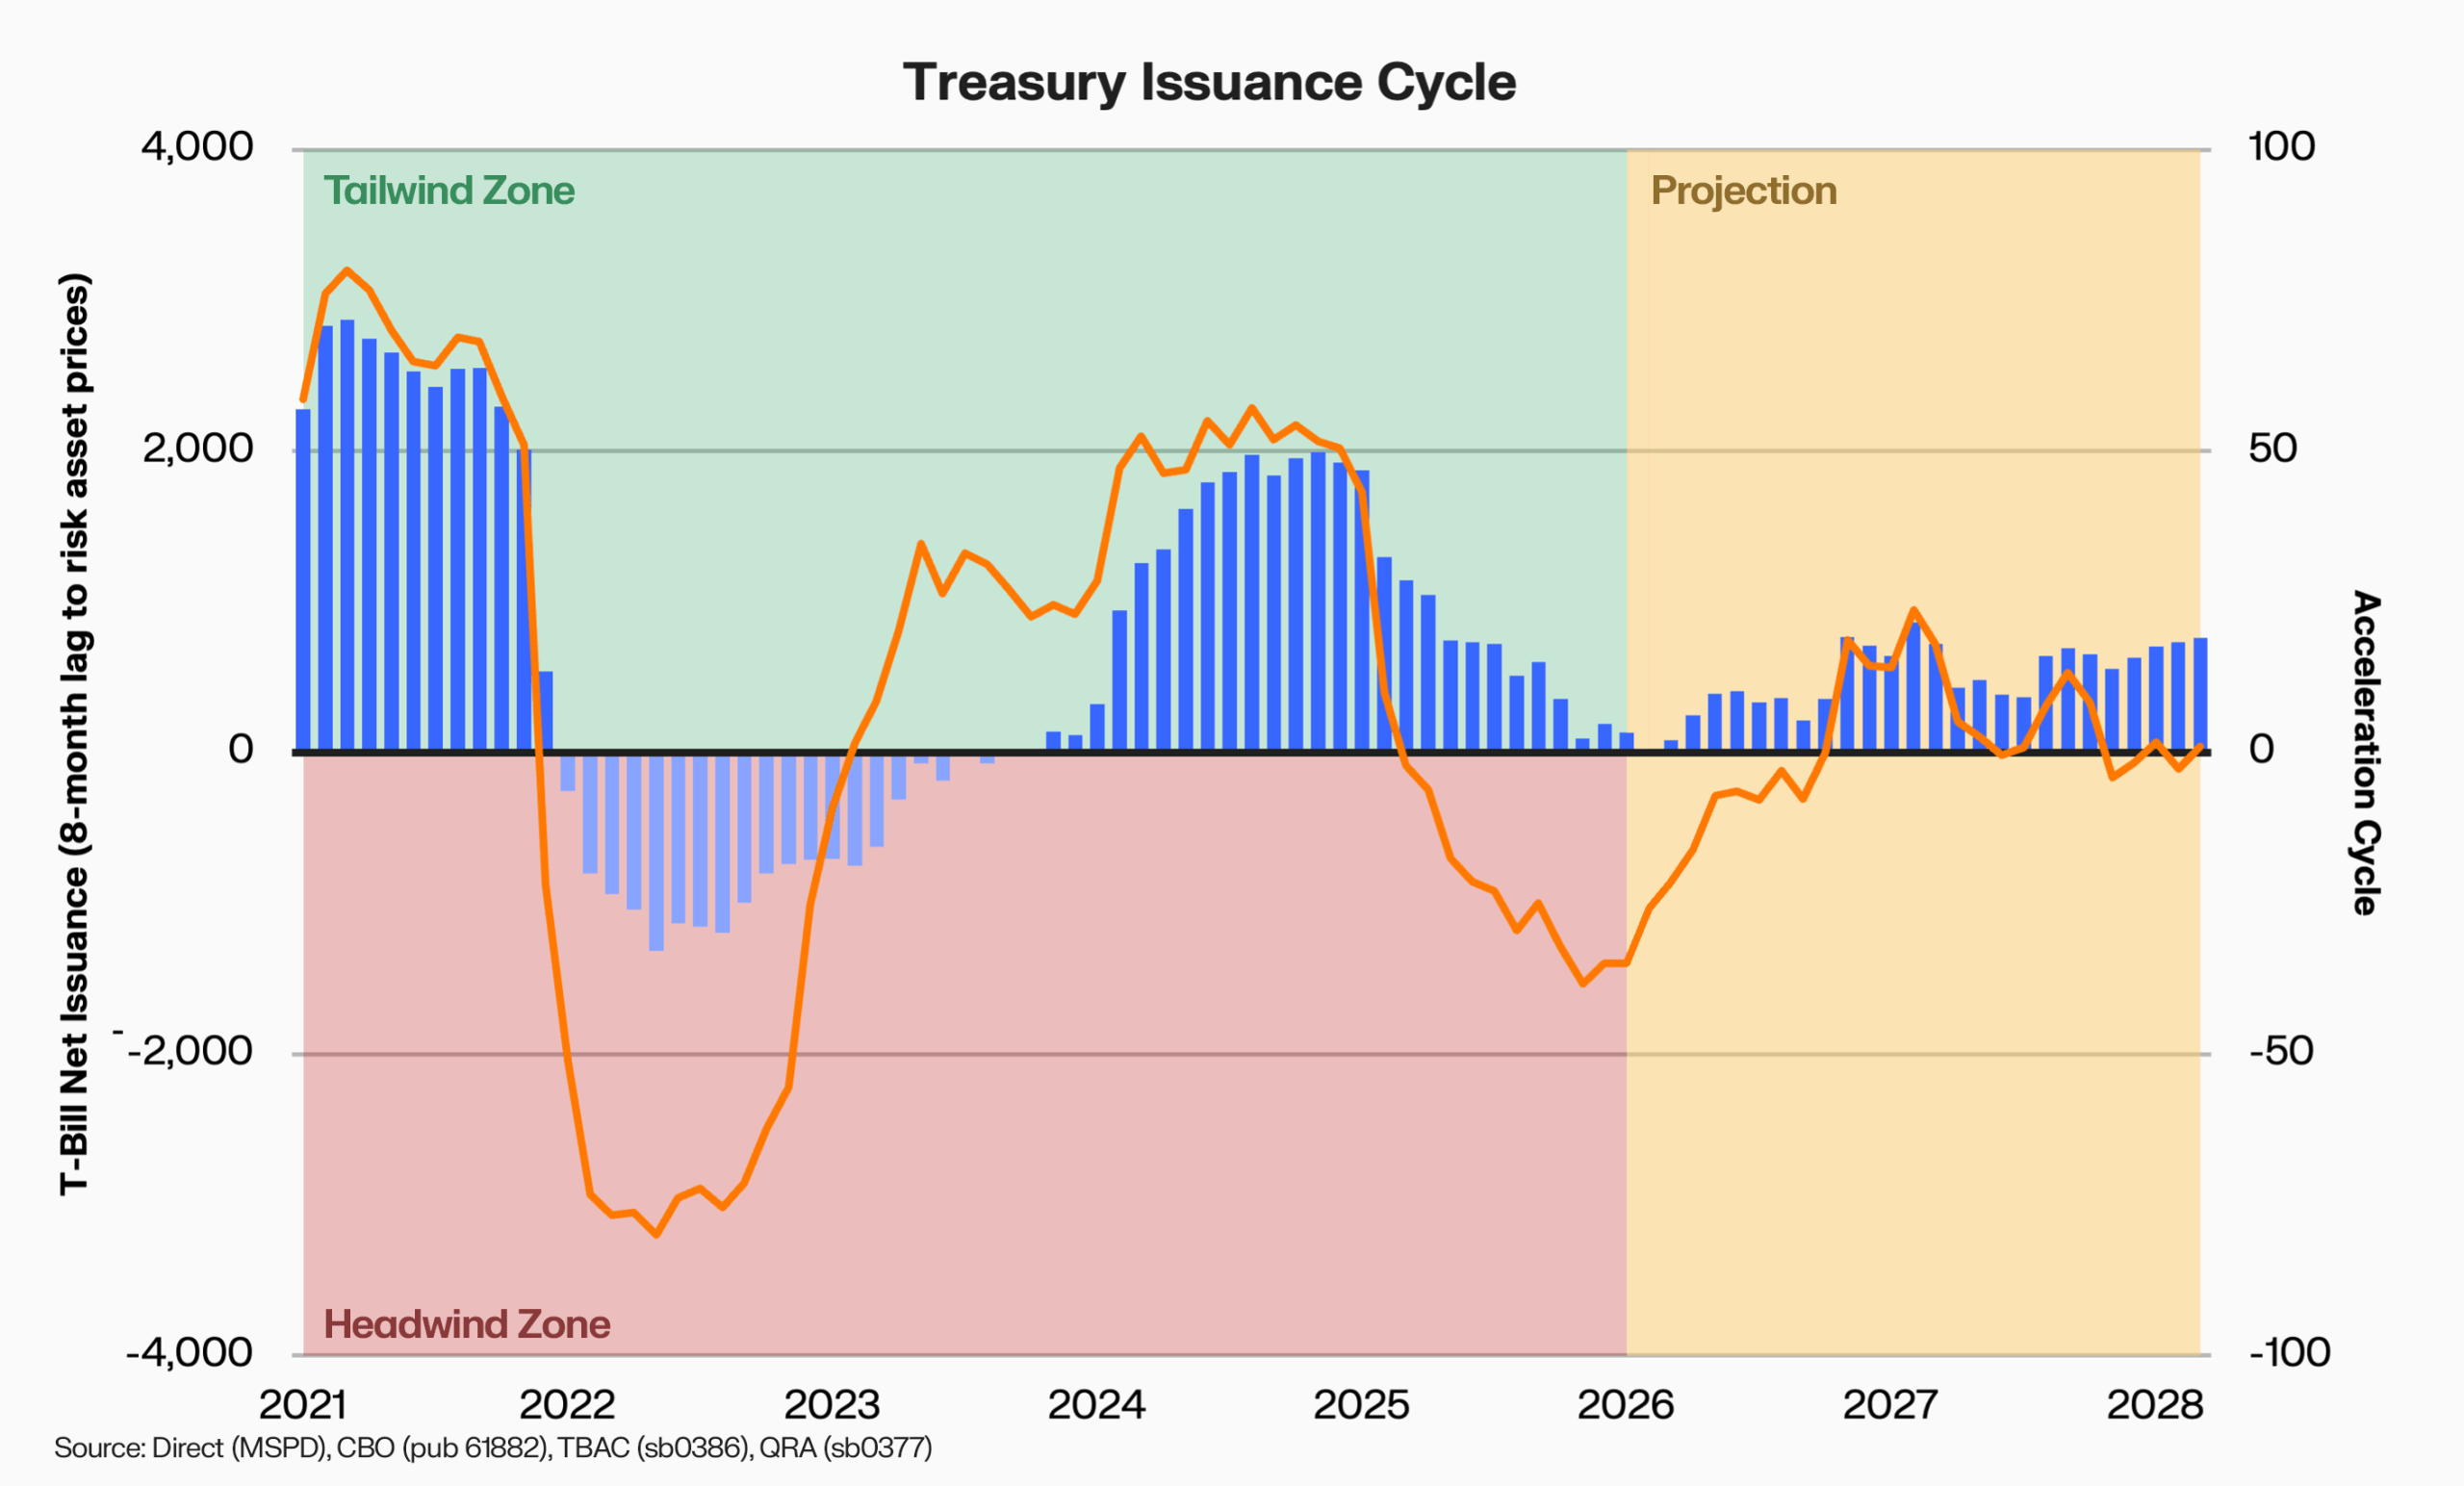
The projection zone uses Treasury’s own borrowing estimates (QRA), the CBO’s latest deficit projections (published February 11, 2026), and TBAC financing guidance to model where T-bill issuance is heading. As the debt refinancing wave accelerates and deficits widen toward $2 trillion, T-bill issuance is projected to reach and sustain +$600-800 billion per year through 2028. This is a multi-year structural acceleration in the same liquidity channel that has historically shown the strongest relationship with Bitcoin.
The market has the capacity to absorb this issuance, though it depends on three structural buyers whose scale is historically unusual. Money market funds hold over $7.8 trillion in assets and have materially increased their holdings of Treasury bills by approximately $2 trillion since 2023. Treasury bills and Treasury-backed repos together make up over 80% of their portfolios. The Federal Reserve’s reserve management purchases, launched in December 2025, are adding $40 billion per month in T-bill demand, separate from QE. And the GENIUS Act, signed in July 2025, requires stablecoin issuers to back reserves one-for-one with high-quality liquid assets including T-bills, codifying a practice that currently channels $150 billion into the bill market, although this is currently marginal.
The projected acceleration in issuance beginning mid-2026 would not be expected to appear in risk asset prices until late 2026 / early 2027. The near term is likely to remain challenging as the lagged impulse continues declining through the first half of 2026. But the structural case beyond that point is building.
Conclusion
Bitcoin is the most liquidity-sensitive asset in public markets, having historically shared 93% of its long-run variance with global liquidity and amplifying moves by 7.6x in both directions. The channel is specific. Treasury bill issuance, not the Fed’s balance sheet or any other type of US QE, has historically shown the strongest leading relationship with Bitcoin.
This mechanism is about to be tested at scale. The US faces a wall of maturing debt, with refinancing needs surging by $3 to $4 trillion per year through 2029. The Treasury cannot easily extend maturities at current rates, so T-bill issuance remains the default. The debt exists, it must be rolled, and rolling it has historically bode well for risk assets.
T-bill issuance impulse peaked in late 2024 and troughs near zero in early 2026. But the structural driver leaves policymakers little choice. Whether funded through bills or eventually absorbed by the Fed, the arithmetic of debt refinancing pushes toward expansion.
The intellectual foundations for understanding how liquidity transmits to asset prices owe much to the work of Michael Howell at CrossBorder Capital, whose research on global liquidity cycles has shaped institutional macro thinking for over a decade. The analysis in this report applies that framework independently, using Keyrock’s proprietary data and methodology.
Disclaimer: The information in this report is for educational purposes only and does not constitute financial, investment, legal, or tax advice. Opinions are based on available data at the time of publication and may change. Keyrock does not guarantee the accuracy, completeness, or suitability of this information. Cryptocurrency investments are speculative and involve significant risks, including potential loss of principal. Consult a qualified advisor before making financial decisions. Keyrock assumes no liability for direct or indirect losses or damages arising from the use of this content.

Stay up to date
Get the latest industry insights, in-house research and Keyrock updates.
This site is protected by reCAPTCHA and the Google Privacy Policy and Terms of Service apply.