

30 March 2026
Key Insights: The Boy Who Cried Ceasefire
Pause, Reject, Extend
Every Monday, we deliver a concise yet comprehensive briefing to help you navigate the week ahead.
Our weekly market dashboard brings together key insights across Macro, Crypto, and Onchain activity, distilled into a clear, actionable format. Whether you’re managing risk or spotting opportunity, start the week informed and aligned.
Join our Telegram Channel to get it delivered directly to your phone.
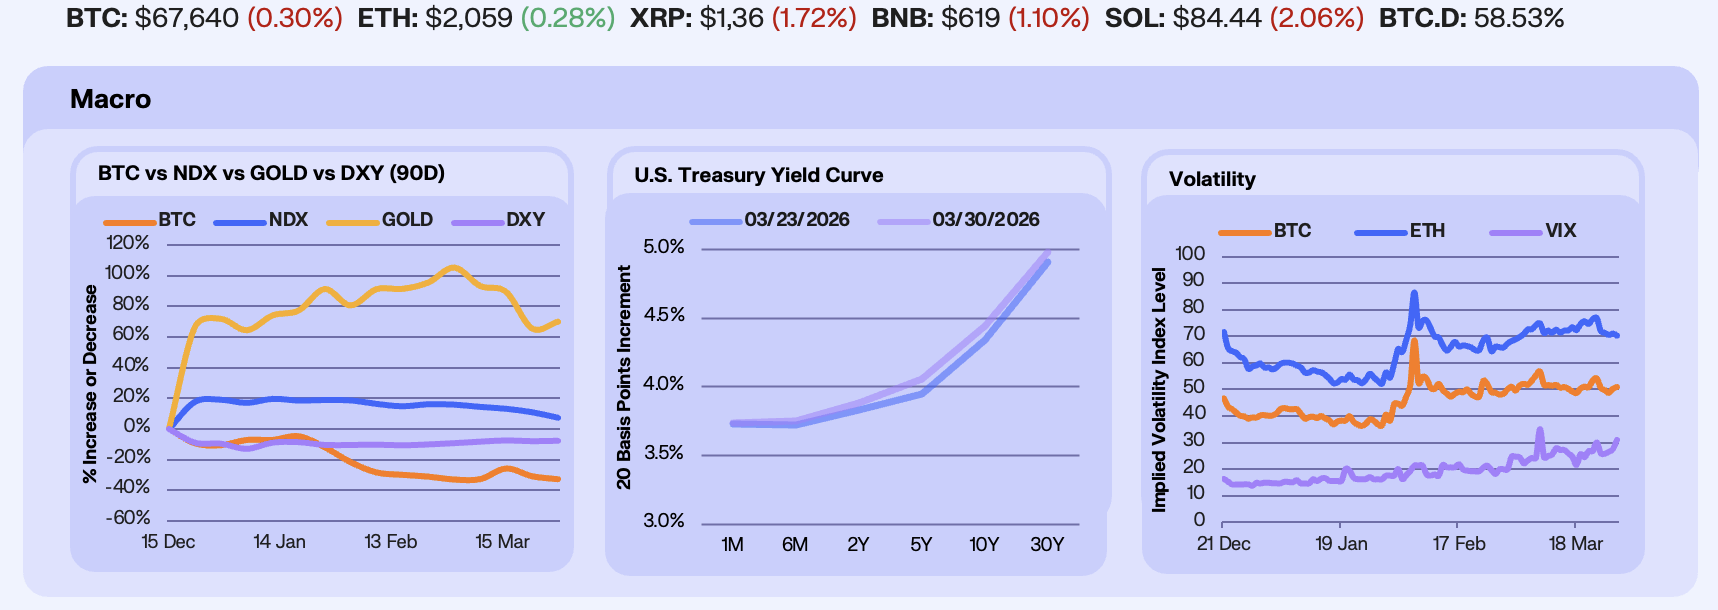
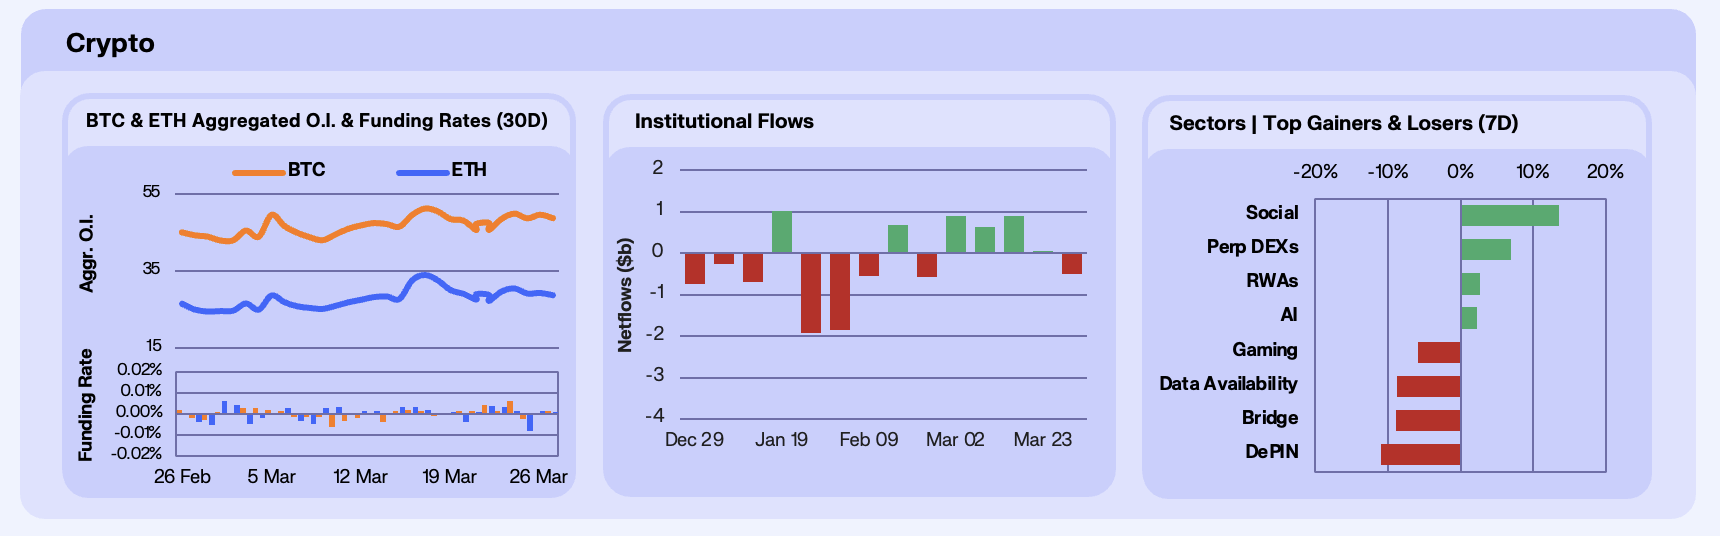
Open interest rebuilt through the ceasefire rally, with BTC climbing from $45.72B to a midweek peak of $49.98B and ETH from $27.50B to $30.38B. Funding stayed positive but muted through the rally, then briefly flipped negative on Thursday and Friday (BTC -0.0024%, ETH -0.0080%) before recovering to positive by Sunday (BTC 0.0015%, ETH 0.0009%). BTC settled at $48.80B (+6.74% WoW) and ETH at $28.61B (+4.04% WoW) despite the drawdown. The pattern reinforces a market that builds leveraged positions on headlines and sheds them just as quickly when the catalyst fades. The funding recovery by Sunday suggests the Thursday-Friday flush cleared the weakest hands, but positioning remains fragile heading into the April 6 deadline.
ETF flows deteriorated sharply. BTC products recorded -$296.3M in net outflows, a stark reversal from last week’s +$93.1M. ETH outflows hit -$206.4M, more than tripling last week’s -$60M. SOL flipped to -$4.4M. All three product categories ended the week in outflows. The average BTC ETF holder now sits roughly 22-25% below their estimated ~$84,000-$88,000 cost basis at $65,957 spot. At close to $300M in BTC redemptions alone, the outflow pace is no longer marginal. Institutional allocators are actively reducing exposure, though total AUM ($83.4B BTC, $11.0B ETH) suggests a de-risking of incremental capital.
Sector performance split between event-driven winners and high-beta losers. Social led at +13.6%, driven by Chiliz as the 2026 FIFA World Cup approaches with the platform’s US market re-entry and a Q2 buyback program providing a tangible bid. Perp DEXs gained +7.0% as volume continued to build around HIP-3 on Hyperliquid. On the downside, DePIN fell -11.0% as token unlock supply pressure and high-beta rotation continued to weigh on the sector. Bridges (-8.9%), Data Availability (-8.7%), and Gaming (-5.8%) also declined. Capital is flowing toward sectors with tangible near-term catalysts and away from narrative-heavy infrastructure plays.
Our Take: Capital is concentrating in BTC again as the rest of the market bleeds. Dominance at 59% reflects a market that wants crypto exposure only at the safest end of the risk curve. ETH continues to absorb the heaviest institutional outflows, and the ETH/BTC ratio remains the clearest expression of this defensiveness. The muted funding through the rally and broad ETF redemptions suggest conviction is thin, and the positioning leaves the market exposed to a sharp move in either direction around the April 6 deadline.
The Bid Narrows
Open interest rebuilt through the ceasefire rally, with BTC climbing from $45.72B to a midweek peak of $49.98B and ETH from $27.50B to $30.38B. Funding stayed positive but muted through the rally, then briefly flipped negative on Thursday and Friday (BTC -0.0024%, ETH -0.0080%) before recovering to positive by Sunday (BTC 0.0015%, ETH 0.0009%). BTC settled at $48.80B (+6.74% WoW) and ETH at $28.61B (+4.04% WoW) despite the drawdown. The pattern reinforces a market that builds leveraged positions on headlines and sheds them just as quickly when the catalyst fades. The funding recovery by Sunday suggests the Thursday-Friday flush cleared the weakest hands, but positioning remains fragile heading into the April 6 deadline.
ETF flows deteriorated sharply. BTC products recorded -$296.3M in net outflows, a stark reversal from last week’s +$93.1M. ETH outflows hit -$206.4M, more than tripling last week’s -$60M. SOL flipped to -$4.4M. All three product categories ended the week in outflows. The average BTC ETF holder now sits roughly 22-25% below their estimated ~$84,000-$88,000 cost basis at $65,957 spot. At close to $300M in BTC redemptions alone, the outflow pace is no longer marginal. Institutional allocators are actively reducing exposure, though total AUM ($83.4B BTC, $11.0B ETH) suggests a de-risking of incremental capital.
Sector performance split between event-driven winners and high-beta losers. Social led at +13.6%, driven by Chiliz as the 2026 FIFA World Cup approaches with the platform’s US market re-entry and a Q2 buyback program providing a tangible bid. Perp DEXs gained +7.0% as volume continued to build around HIP-3 on Hyperliquid. On the downside, DePIN fell -11.0% as token unlock supply pressure and high-beta rotation continued to weigh on the sector. Bridges (-8.9%), Data Availability (-8.7%), and Gaming (-5.8%) also declined. Capital is flowing toward sectors with tangible near-term catalysts and away from narrative-heavy infrastructure plays.
Our Take: Capital is concentrating in BTC again as the rest of the market bleeds. Dominance at 59% reflects a market that wants crypto exposure only at the safest end of the risk curve. ETH continues to absorb the heaviest institutional outflows, and the ETH/BTC ratio remains the clearest expression of this defensiveness. The muted funding through the rally and broad ETF redemptions suggest conviction is thin, and the positioning leaves the market exposed to a sharp move in either direction around the April 6 deadline.
End of Looping
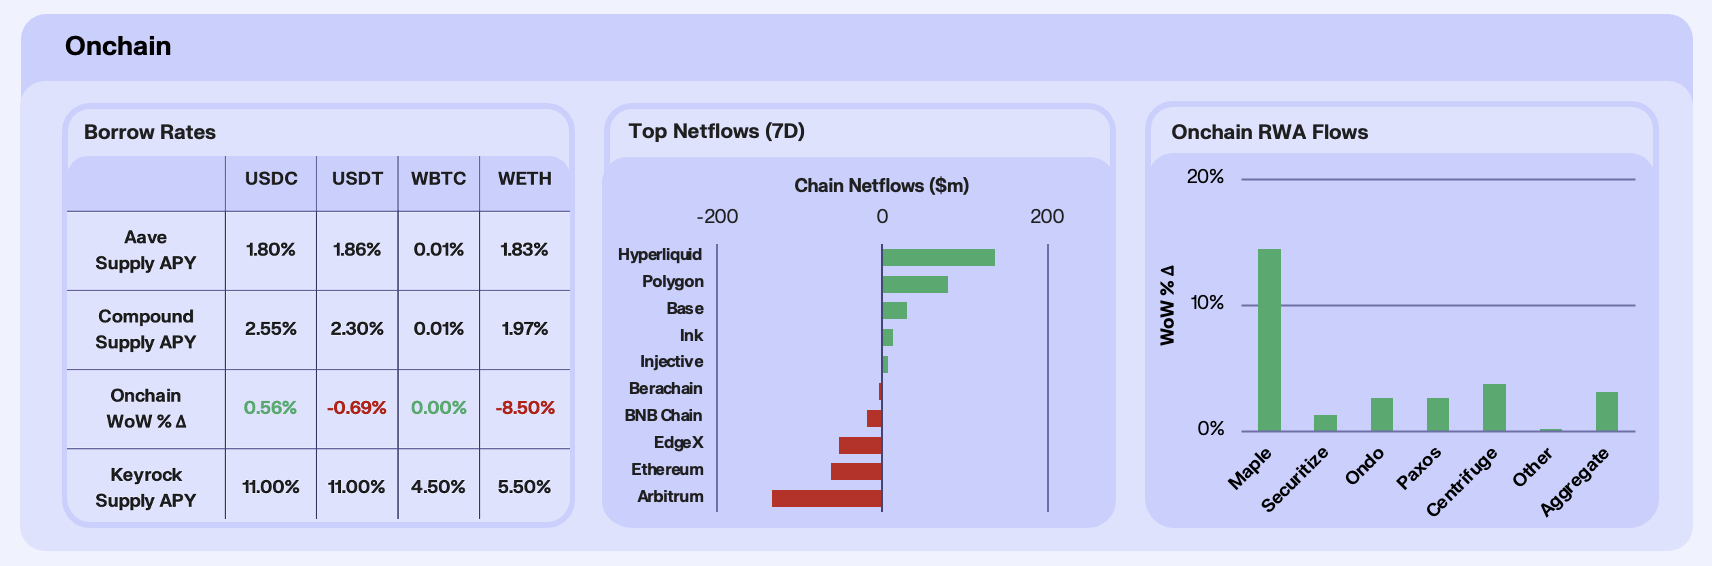
Onchain rates were broadly flat with a slight bias towards a contraction this week, suggesting that lending markets are stabilising after several weeks of compression. Stablecoin yields showed minimal movement, with USDC supply APY up 0.6% WoW and USDT down 0.7%. ETH-denominated yields continued to soften, with WETH down 8.5% WoW. Utilisation across lending markets remains low, indicating that capital is not yet rotating back into broad looping strategies, and that traders continue to express views through alternative venues. This is a trend we see sustaining, possibly marking the end of looping utilisation onchain, at least to the extent we’ve seen historically.
Chain-level flows were far more directional, with capital concentrating in ecosystems with clear, week-specific catalysts. Hyperliquid led inflows (+$136.7m) as derivatives activity accelerated, with open interest hitting new highs and strong volumes across tokenised commodity and index perpetuals. The addition of TradFi-linked perps and continued macro volatility has reinforced Hyperliquid’s role as a 24/7 trading venue, pulling in capital from traders looking to express macro views outside traditional market hours. Polygon PoS (+$79m) also saw strong inflows, driven by a surge in real-world payments and stablecoin usage, with transaction counts and active USDC addresses reaching new highs. In contrast Ethereum (-$62.6m) saw outflows, as it continues to act as a liquidity source, with ETF outflows and muted onchain activity limiting inflows despite broader market strength.
RWAs were a clear bright spot, with aggregate AUM up 3.15% WoW, driven by highly concentrated, event-led inflows. Maple (+14.52%) significantly outperformed following its inclusion in the Sky Ecosystem’s Obex program, which is deploying up to $1bn into onchain credit strategies, driving meaningful capital into its lending products. Securitize (+1.35%) and Centrifuge (+3.77%) also benefited from the same institutional pipeline, while Ondo (+2.67%) saw inflows tied to its partnership with Franklin Templeton to bring tokenised ETFs onchain.
Our take: The onchain economy is increasingly bifurcated between trading-driven and utility-driven capital flows. On one side, platforms like Hyperliquid are capturing speculative and macro-driven flows through high-velocity derivatives markets. On the other, ecosystems like Polygon are attracting steady, payments-driven liquidity.The next inflection point will be whether this capital begins to recycle back into lending markets, signalled by a sustained pickup in utilisation rather than headline-driven flows.
Agents Start Spending
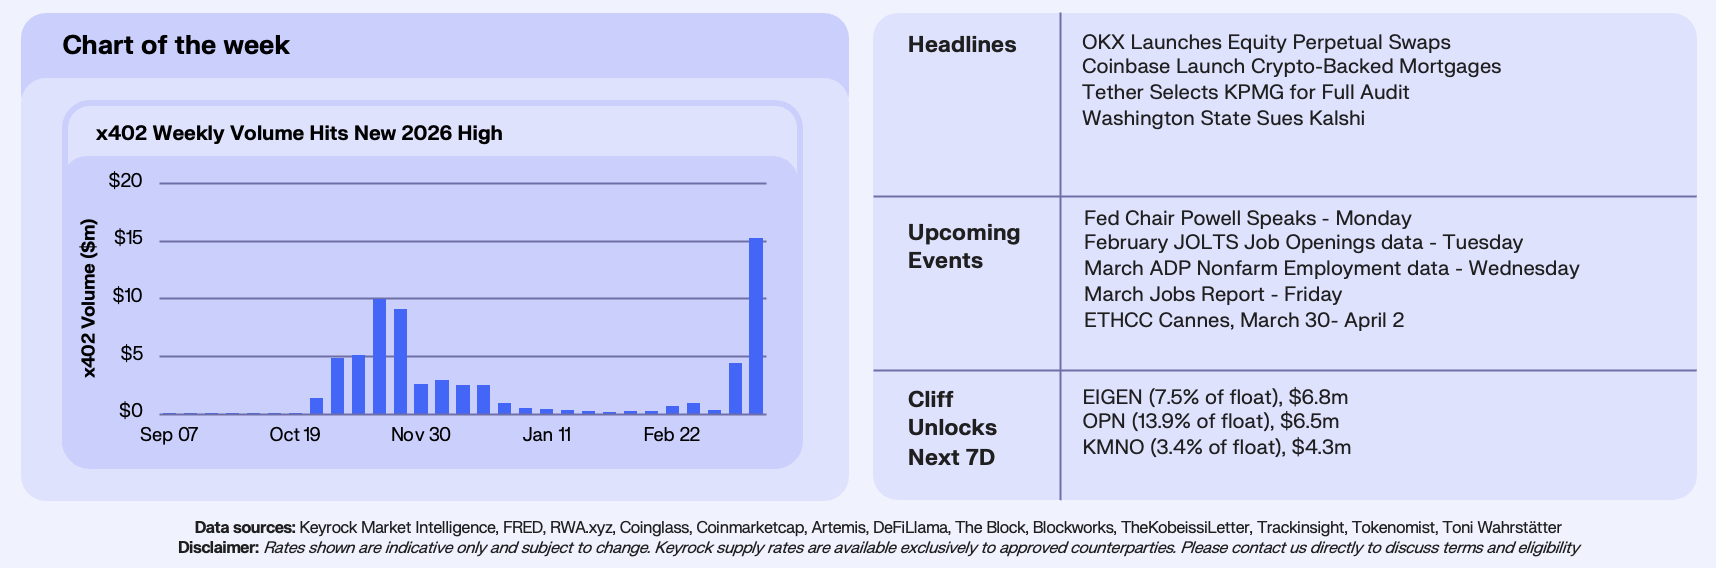
This week’s chart tracks x402 weekly volume, the open payments protocol developed by Coinbase that enables AI agents to programmatically pay for API access, data, and digital services using USDC. x402 volume hit $15.3 million this week, its highest level since the November 2025 launch spikes and roughly 3x the previous 2026 high. To put this in context, from January through early March, weekly volume had been grinding through a $200K-$1M range, until in the space of two weeks, it jumped 15x.
x402 launched in May 2025 to near-zero activity, spiked to $10M during the November hype cycle as developers experimented, then bled down through the winter to sub-$300K weeks by January. What’s different this time is that the ramp appears structural rather than speculative, in that x402 merchant count has grown from a handful at launch to approximately 3,900 today, including AWS, Alchemy, and Messari. Average transaction sizes have climbed from sub-$1 to the $20-25 range this month.
Our Take: In our 12 Charts to Watch in 2026, we predicted that x402 weekly volume would exceed $100M by the end of 2026, a 10x multiple on the 2025 weekly ATH. At $15.3M this week, we’re roughly 15% of the way there, with nine months remaining. For this prediction to land, x402 needs to sustain the current trajectory and absorb growth from the expanding agent ecosystem, which now includes MPP, Google’s AP2, and Visa’s Intelligent Commerce initiative. The competitive landscape has shifted since we published that prediction, x402 is no longer the only game in town. That said, it remains the most established onchain rail, and this week’s volume suggests that agent-driven demand is arriving faster than the winter lull implied. The metric we’re watching most closely is whether $10M+ weeks become the baseline rather than the exception of a one-off spike, for our desk, that would signal the transition from early adopter experimentation to genuine commercial traction.
Join our Telegram Channel to get it delivered directly to your phone.

Stay up to date
Get the latest industry insights, in-house research and Keyrock updates.
This site is protected by reCAPTCHA and the Google Privacy Policy and Terms of Service apply.