

16 February 2026
Key Insights: Return of the Long End
Growth Fears Resurface
Every Monday, we deliver a concise yet comprehensive briefing to help you navigate the week ahead.
Our weekly market dashboard brings together key insights across Macro, Crypto, and Onchain activity, distilled into a clear, actionable format. Whether you’re managing risk or spotting opportunity, start the week informed and aligned.
Join our Telegram Channel to get it delivered directly to your phone.
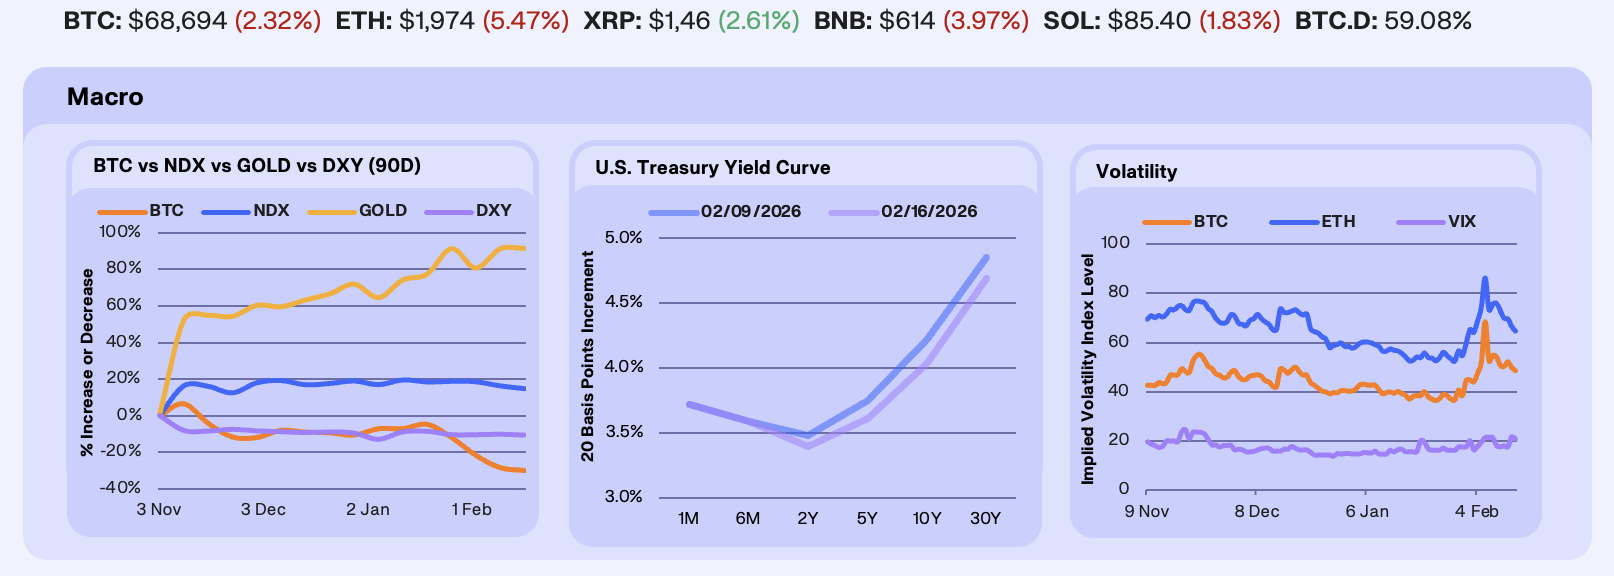
Last week was defined by softer labor data and cooling inflation, reinforcing a fragile growth backdrop. January payroll revisions marked the largest downward adjustment since 2009, underscoring a weaker labor market than previously reported, while CPI surprised modestly to the downside, which offered a mild lift to risk assets into the weekend and pressured the dollar. At the same time, recent rapid advancements from OpenAI and Anthropic continue to add concerns around AI-driven disruption, weighing on tech valuations. BTC fell −2.2% on the week, gold edged up +0.2%, NDX declined -1.3%, while the DXY eased −0.5%.
Rates markets leaned decisively into the slowdown narrative. Treasury yields declined across the curve, led by the long end (30Y -13 bps, 10Y -18 bps, and 5Y -14 bps) following one of the strongest long-bond auctions on record. The scale of demand signals institutional conviction that growth risks are rising and that duration offers relative value at current real yield levels. Following benchmark job revisions, the sharpest downward adjustment since 2009, traders are pricing in a 93% probability of no rate cuts at the March meeting and a 23% chance of a 25 bps cut in April.
Volatility remained elevated after last week’s liquidation cascade, though it moderated at the margin. BTC 30-day IV fell -1.5% WoW to 49, ETH IV declined -14.6% to 65, and the VIX ticked down -3% to 21, reflecting persistent equity fragility. Options skew remains defensive, with traders continuing to pay for downside protection. Option markets now price a 62% probability of BTC reaching $50,000 in 2026 versus 41% odds of reclaiming $100,000, underscoring a material shift from last week in forward expectations.
Our Take: Bitcoin continues to trade as a high-beta extension of tech, struggling to decouple during growth-led drawdowns. Rather than hedging fiat risk, its rising correlation with software stocks continues to weaken its diversification case. Until it begins responding inversely to dollar weakness, its macro hedge narrative remains challenged.
Institutions Buy the Dip
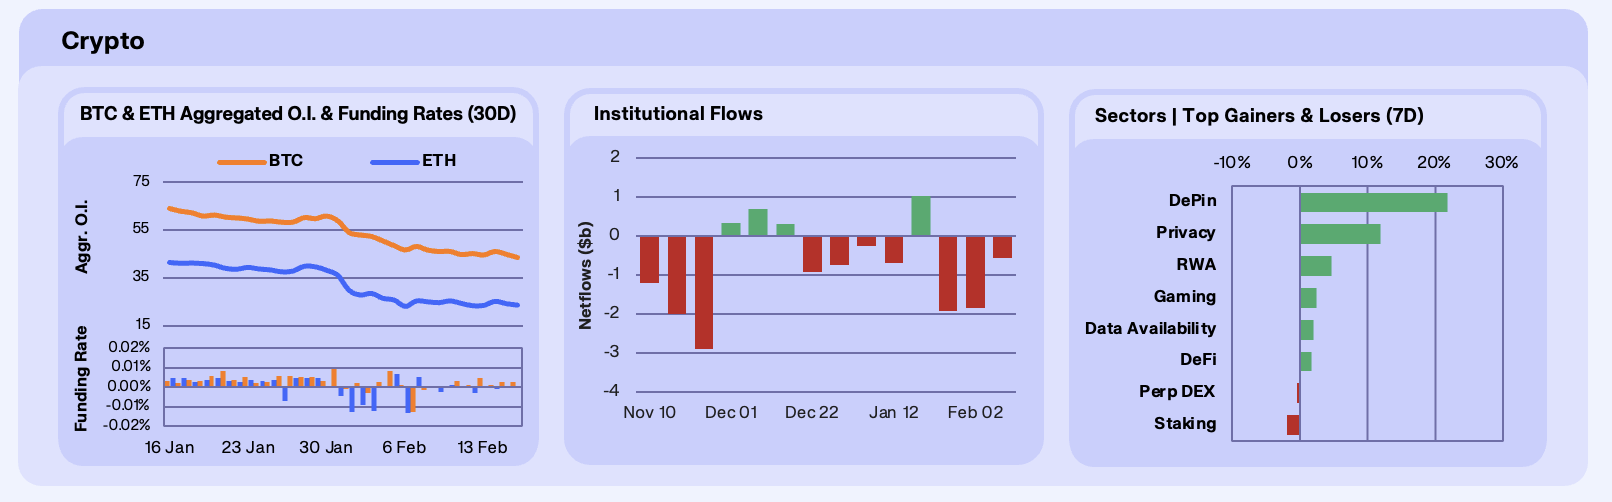
Majors drifted lower this week after an initial rebound attempt, with BTC -3%, ETH -7.2%, and SOL -1.8%, as positive macro prints only managed to spark short-lived squeezes. Despite the mid-week tone improving on softer inflation optics, follow-through was capped by lingering risk aversion and whale repositioning, including notable PayPal-linked transfers and sizable Coinbase deposits. BTC open interest fell -2.65% WoW and ETH OI fell -4.65% WoW, consistent with de-risking after last week’s volatility. Funding stayed modestly positive for Bitcoin, while Ethereum funding printed mostly flat-to-slightly-negative across the week, an important micro signal that ETH remained the more cautious asset even when spot tried to bounce.
Institutional flows, however, told a different story to price action. Digital asset investment products printed +$685m net inflows, led by BTC (+$394m) and ETH (+$191m), with Solana also positive (+$30.6m) and Ripple adding (+$70.1m). The divergence between price action and institutional allocation suggests dip-buying and longer-horizon accumulation, a leading signal of market confidence that we have seen at least a local bottom.
Sector performance was highly selective, with specific sub-sectors vastly outperforming the broader risk-off narrative. DePIN ripped (+21.8%) on a narrative of real activity and revenue, with names like Render, Helium, and Filecoin leading . This narrative was spurred on by talks of AI-compute getting attention following Nvidia-related “compute scarcity” framing. Privacy also outperformed (+12.0%) as the market repriced regulatory headlines, with Zcash, Monero, and Dash catching the bid. Underperformers included Perp DEX (-0.4%) and Staking (-1.9%), which fits a market structure where traders want optionality and liquidity, not duration-like exposure.
Our take: This week looked like repositioning, with spot bleeding and leverage coming down, but institutions being net buyers and certain sectors showing clear catalysts. The setup into next week is constructive if OI stabilises and ETH funding stops leaning negative on rebounds. If not, expect continued chop where only the most narrative-dense sub-sectors outperform while majors grind.
Onchain Barbell
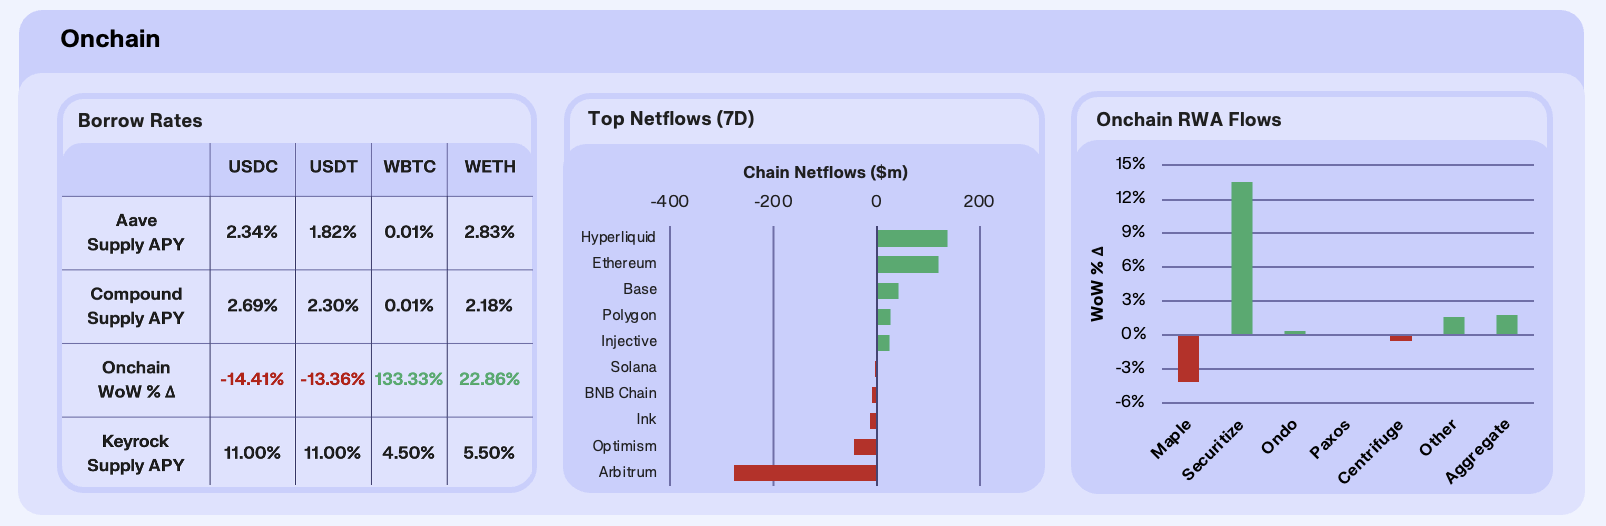
Onchain stablecoin rates declined in tandem this week, while ETH-denominated yields spiked, consistent with liquidity rotating away from dollar-leverage and towards more selective positioning. On Aave, USDC supply APY sits at 2.34% and USDT at 1.82%, with both down roughly 14% WoW at the aggregate level. In contrast, WETH supply yield moved higher, which we interpret as a cleaner signal of less stablecoin-driven looping pressure, and more targeted demand for ETH-liquidity such as hedging, basis positioning, or tactical leverage.
Cross-chain flows reinforced this rotation, with Hyperliquid leading the week with +$139m net inflows, aligning with a market structure where traders prefer risk-on perps venues when spot chops and catalysts are time-sensitive. Base added +$43m, consistent with stablecoin-heavy usage and payments routing staying sticky, while Arbitrum saw the largest move on the week at -$278m, largely consistent with bridge-driven rotation out of L2 liquidity and into Hyperliquid.
RWAs were net positive at the headline level, up 1.77% aggregate AUM WoW, but the composition matters more than the total. Securitize did most of the work (+13.5%), helped by improved secondary liquidity optics via its collaboration with Uniswap, enabling onchain access and routing for BlackRock BUIDL via UniswapX. Credit-heavy protocols underperformed, with Maple Finance down (-4.1%) and Centrifuge slightly negative (-0.49%), consistent with allocators trimming duration and credit beta when macro risk is still loud.
Our take: This week looks like a ‘barbell’ onchain market, with trading risk concentrating where execution is best, while balance-sheet risk concentrating where liquidity is deepest. In RWAs, the market is explicitly paying for distribution and secondary liquidity, which is a healthy evolution if it persists. The next upside signal we’re watching is utilisation-led rate strength which would signal demand pulling rates up.
Bitcoin’s Liquidity Beta
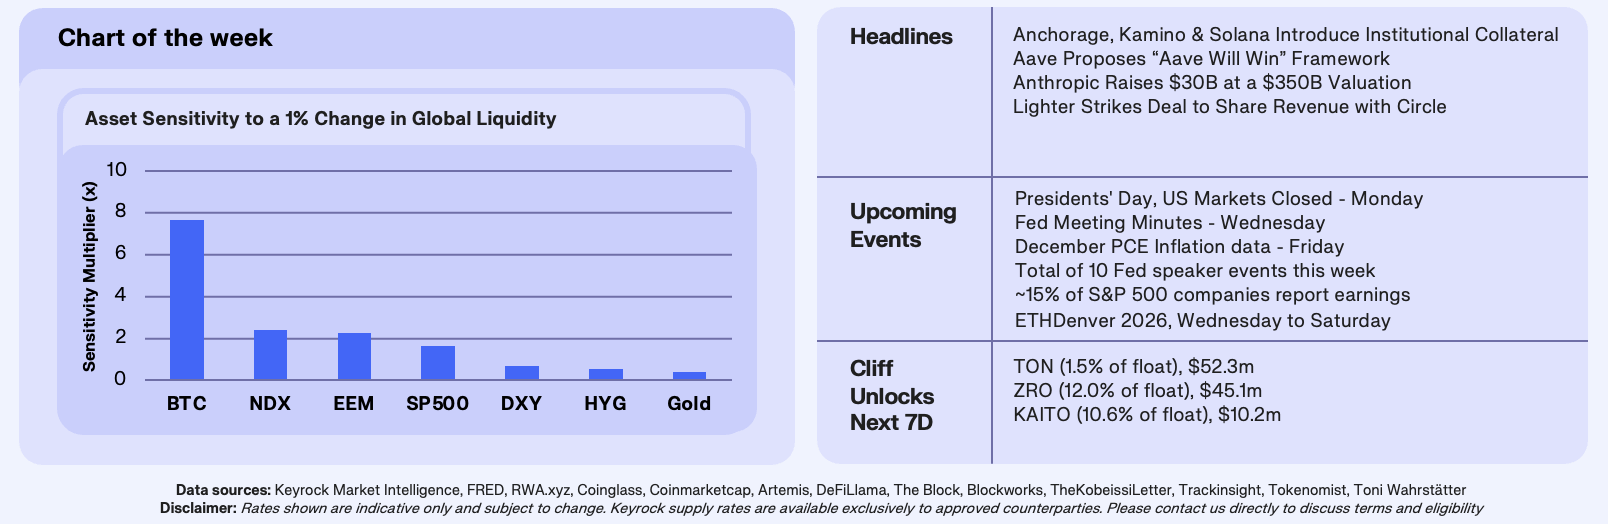
Ahead of our report release on Wednesday, which applies a global liquidity framework to Bitcoin and examines why it has diverged from aggregate liquidity, we began with a foundational question. Does global liquidity explain Bitcoin at all and, if so, how does that sensitivity compare across major asset classes? Using weekly data from 2010 through early 2026, Bitcoin and our global liquidity index have shared 93% of their long-run variance, making liquidity the dominant historical driver of BTC.
We found that for every 1% change in global liquidity, Bitcoin has historically moved 7.6% over the following quarter. The Nasdaq 100 has moved 2.4%, high yield credit 0.5%, and gold 0.4%. The gap between Bitcoin and the most sensitive equity index has been more than 3x. No traditional asset has exhibited comparable liquidity beta than BTC.
That ranking has also remained consistent across time, although BTC has become less sensitive to liquidity over time. We tested three non-overlapping windows, pre-COVID, post-COVID, and the full 2017–2026 sample, and Bitcoin remained at the top in each. Bitcoin’s sensitivity to global liquidity has dropped by 24% since COVID. The introduction of spot ETFs and deeper institutional participation appears to have moderated Bitcoin’s sensitivity, likely by introducing a larger pool of relatively price-insensitive capital.
Our Take: Global liquidity is a blunt instrument. Liquidity does not enter the system through a single channel, nor does it transmit to risk assets on the same timeline. In Wednesday’s report, we decompose global liquidity into its underlying components and test each independently against Bitcoin. One channel has recently dominated the others by a wide margin. Identifying which liquidity source has recently mattered for Bitcoin is essential to explaining recent divergences and anticipating where the next impulse may originate.
Join our Telegram Channel to get it delivered directly to your phone.

Stay up to date
Get the latest industry insights, in-house research and Keyrock updates.
This site is protected by reCAPTCHA and the Google Privacy Policy and Terms of Service apply.