

15 June 2026
Key Insights: Parking the Bus
Parking the Bus
Every Monday, we deliver a concise yet comprehensive briefing to help you navigate the week ahead.
Our weekly market dashboard brings together key insights across Macro, Crypto, and Onchain activity, distilled into a clear, actionable format. Whether you’re managing risk or spotting opportunity, start the week informed and aligned.
Join our Telegram Channel to get it delivered directly to your phone.
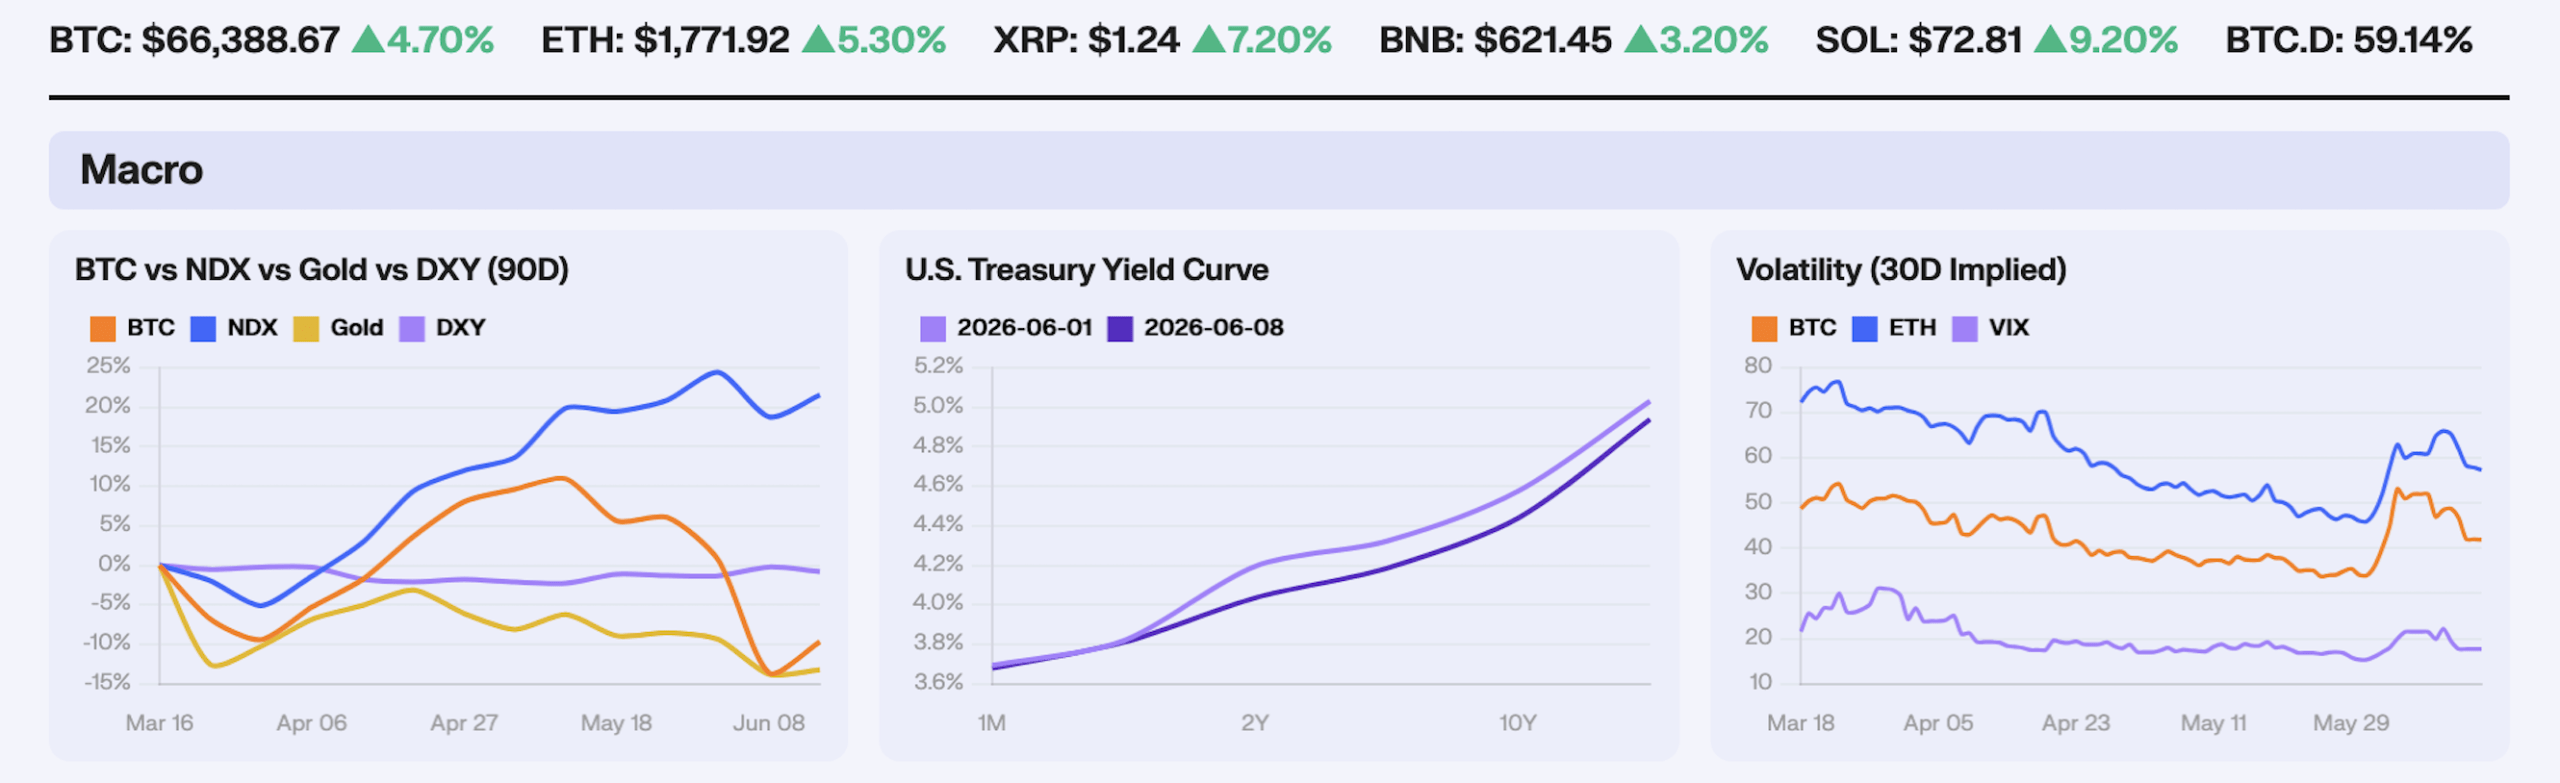
This week we saw risk assets rally through an inflation challenge, with the NDX adding 2.34% WoW, Bitcoin climbing 4.58% to $65,761, and the dollar softening, with DXY off 0.59%. Gold was effectively flat, up 0.66%. The data ran hot on the surface, yet markets read the details as dovish and positioned into a Federal Reserve meeting that is all but certain to leave rates unchanged. A softer core inflation print and a drop in household inflation expectations gave equities and Bitcoin the cover to rally, and with officials in their pre-meeting blackout, there was no Fed voice around to interrupt with a hawkish word. The result was a broad risk-on week sitting on top of an inflation picture that, taken at face value, argues the other way.
May CPI rose 0.5% on the month, in line, but the annual rate jumped to 4.2%, the highest since 2023, with energy responsible for more than 60% of the monthly gain. The relief was in the core, up just 0.2% against the 0.3% expected. The real upside shock came from PPI, where wholesale prices rose 1.1% on the month versus 0.7% expected, taking the annual rate to 6.5%, the hottest since 2022, led by a 23.4% surge in wholesale gasoline. Labour softened at the margin, with initial jobless claims rising to a three-month high of 229k against 219k expected. The Treasury curve had already richened into the week, the 2Y at 4.04%, the 10Y at 4.44% and the 30Y at 4.94%, each lower by between 9 and 16bp over the prior week and led by the front end. With the Fed silenced by blackout, the hot pipeline data landed without pushback, leaving the 17 June dot plot as the arbiter.
Volatility came in hard, what our desk notes is a signature of a relief rally. The VIX fell about 12%, Bitcoin’s 30-day ATM implied volatility dropped a similar 12%, and Ether’s 30-day implied volatility fell 13%. The compression is real, but Bitcoin IV near 42 still sits well above the 33 to 37 range that held through much of 2025. Long-run inflation expectations eased to 3.4% from 3.9% and the one-year measure fell to 4.6%, a notable counterpoint given how hot the same week’s CPI and PPI ran.
Our Take: The week was a placeholder for the 17 June FOMC. With a hold at 3.50 to 3.75% priced at roughly 97%, the decision itself is a non-event, and the dot plot and the press conference are the trade. The risk rally that ran this week leaned entirely on the dovish read, the soft core CPI and the easing inflation expectations, so the asymmetry into Wednesday is hawkish. CPI at a three-year high and the hottest PPI since 2022 give the committee every excuse to nudge the 2026 dots higher, and any upward drift, or a press conference that leans against cuts, reverses this week’s vol compression in short order. Watch the long-run dot and the 2026 median specifically.
The Narrative Rotation
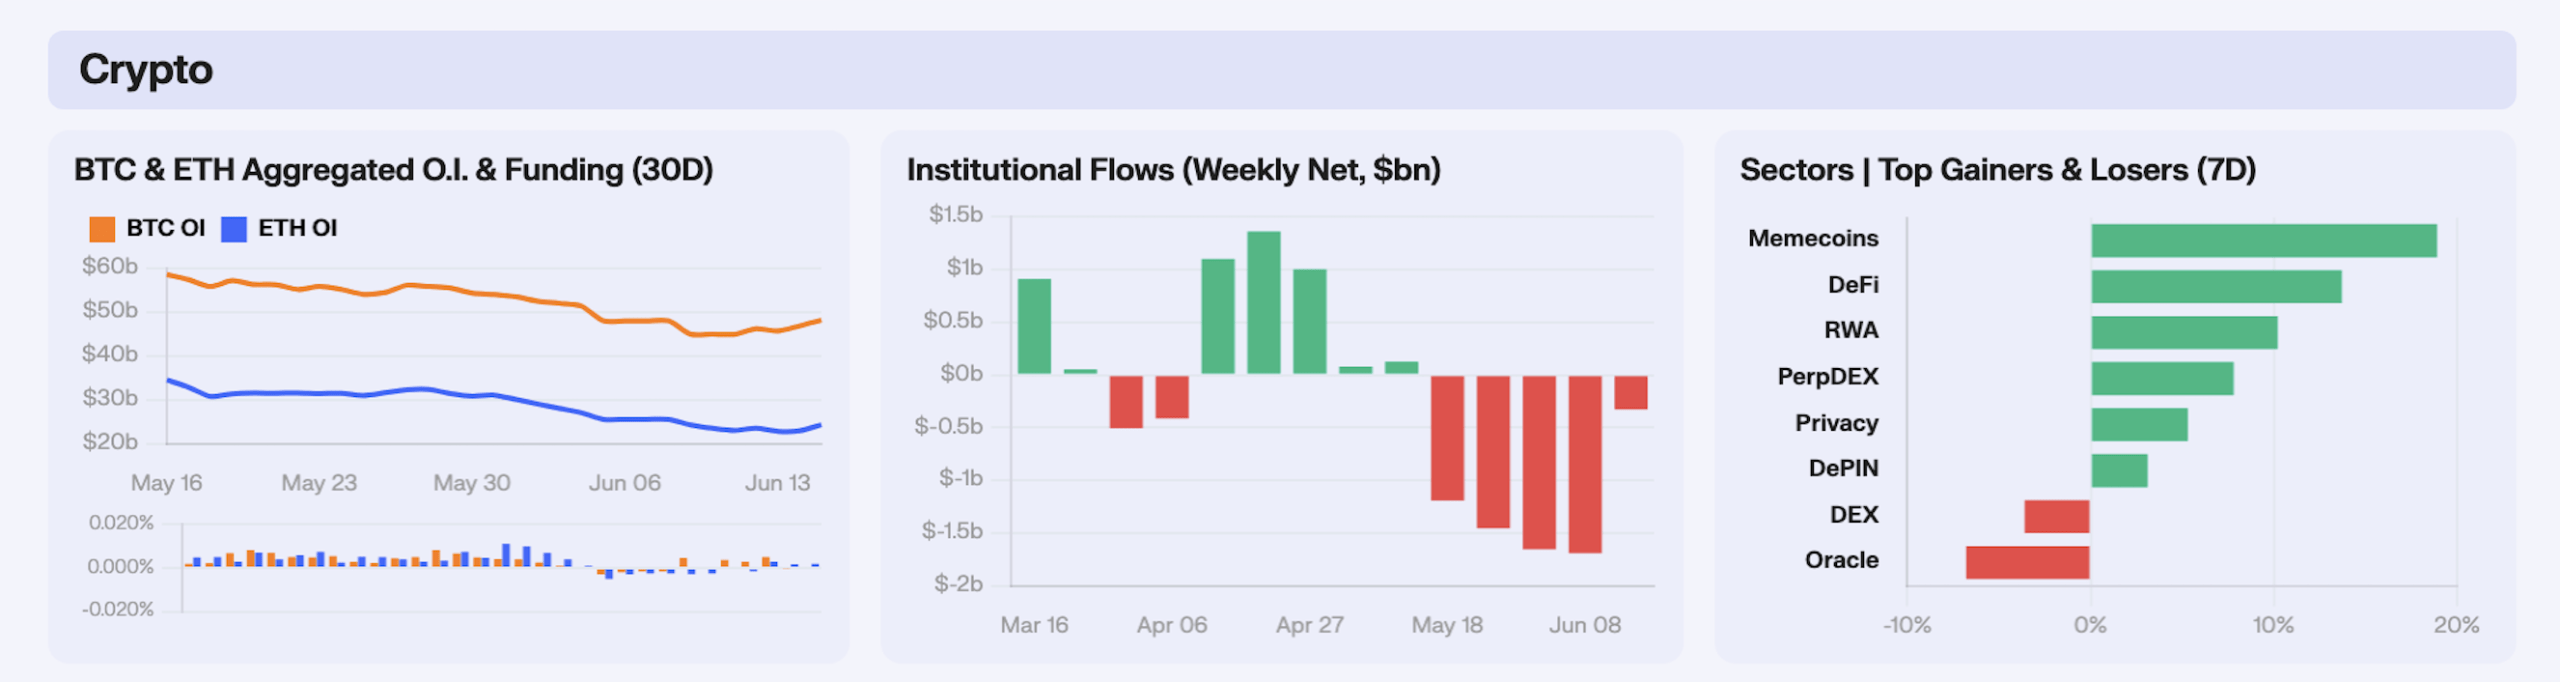
Bitcoin open interest did the talking this week, climbing 7.12% even as price stayed contained. OI dipped to $44.9B by Thursday before grinding higher into the weekend, and funding never ran hot, mostly holding below 0.005% with a single flip negative on the 14th. That’s positioning rebuilding on muted carry, not a leverage chase. ETH ran the opposite shape with open interest dead flat at +0.17%, but funding flipped from −0.0028% early in the week to +0.0020% by Sunday. ETH leverage is being rebuilt off a washed-out base while Bitcoin’s is being added to from already-elevated levels.
That build sits awkwardly against the flow tape, where spot Bitcoin ETFs bled $319M on the week, with a heavy $213.9M redemption on the 10th before a partial rebound of +$85.9M on the 12th. ETH products shed $15M despite a strong +$82.4M opening day, and SOL leaked $4.1M. XRP was the only major to pull net inflows, +$10.7M, taking cumulative since-launch flows to roughly $1.44B and pushing it ahead of SOL’s $1.12B. The wrapper kept broadening too, as the SEC cleared T. Rowe Price’s actively managed multi-asset crypto ETF on the 12th, the first active product able to hold up to 15 large-caps in one vehicle. So spot allocators were trimming Bitcoin and reaching down the cap spectrum while derivatives desks piled into Bitcoin OI.
That split showed up as a hard rotation down the risk curve. AI led at +21.4%, ChainOpera’s COAI ripping over 30% off the 12 June SpaceX IPO that vaulted Musk past a trillion-dollar net worth and reignited every AI-token narrative on BNB Chain. Memecoins rode the same impulse to +18.9%, DOGE jumping to around $0.091 on the trillionaire headline. DeFi added +13.7% as SEC Chair Atkins floated an innovation exemption for blue-chip protocols and Uniswap leaned into its fee-burn mechanics. The bottom of the table was all infrastructure, as DEX fell −3.6%, dragged by Jupiter and a $1.34M Raydium legacy-pool exploit on the 10th, and Oracle was worst at −6.8%, Chainlink sliding toward $7.70 with nothing fresh to offset the holder-yield critique.
Our Take: The tell this week is the gap between OI and ETF flows. Bitcoin open interest up 7% while spot vehicles bled $319M is leverage filling the space institutional money is vacating, and that’s a more fragile bid than a green OI chart makes it look. Pair that with a sector tape where AI and memecoins are outrunning everything on one equity-market headline, and you have a market carried by narrative and notional rather than spot accumulation. Watch funding into next week, with sub-0.005% and the build is survivable, but the first sustained positive funding flush alongside another ETF outflow print is the setup for a long squeeze.
Rates Down, Deposits In
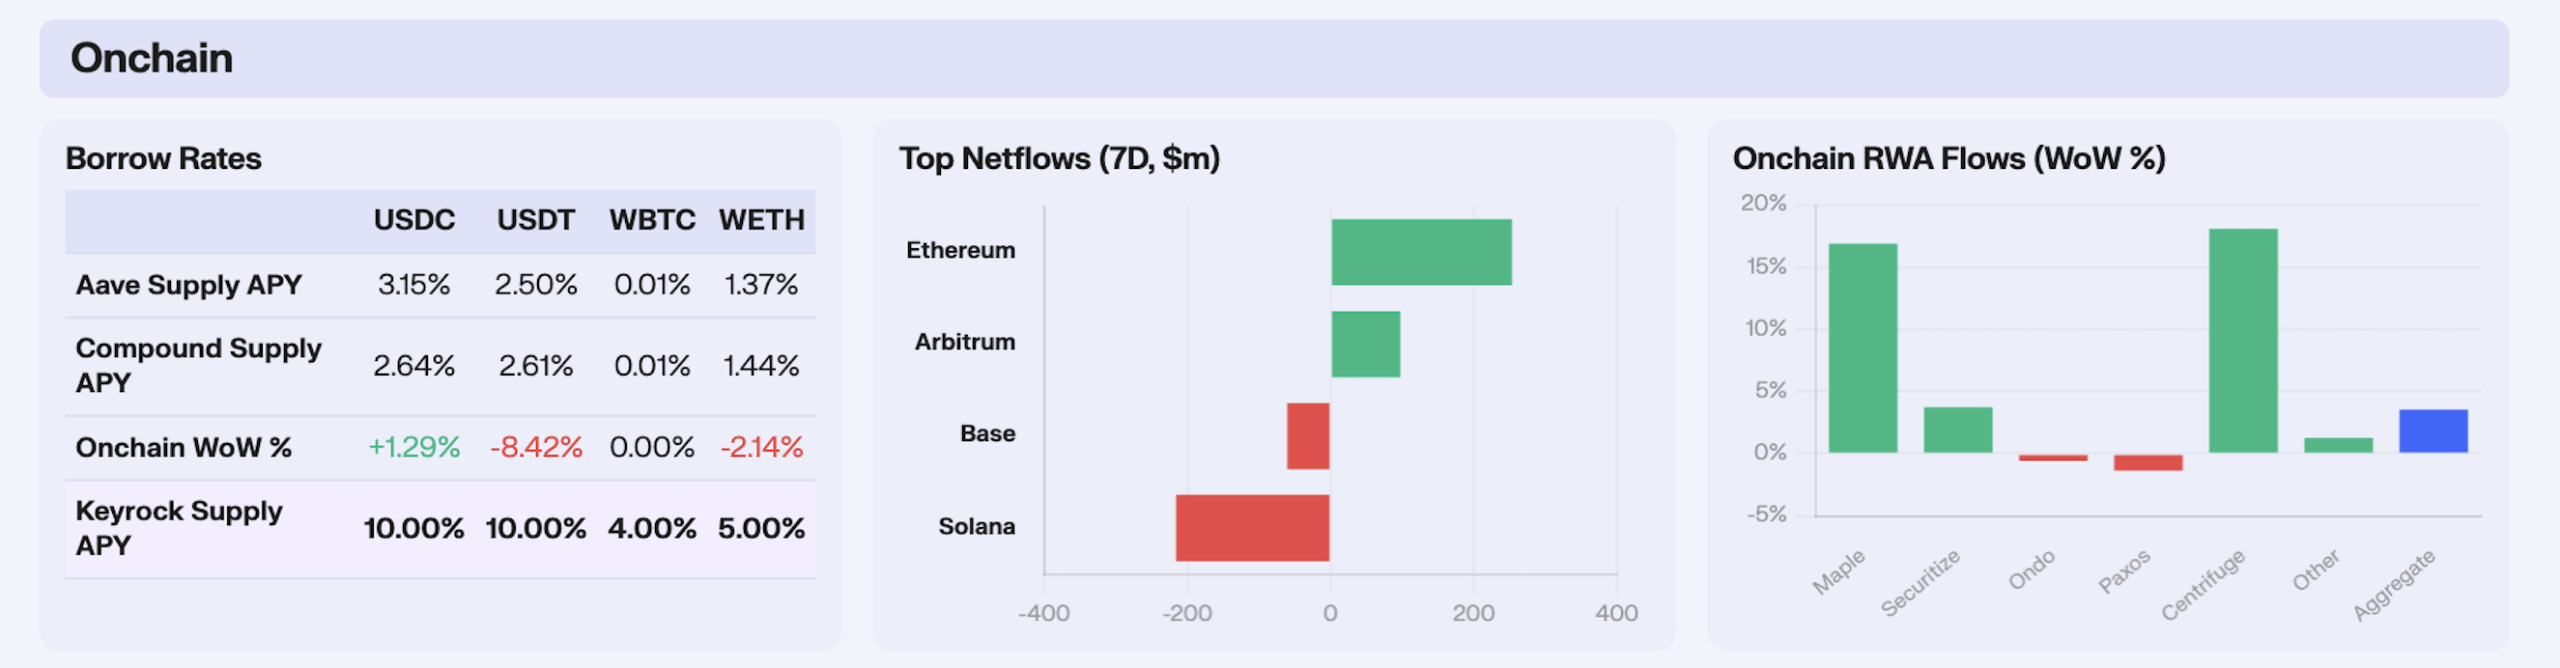
On Aave and broader onchain lending markets, the story this week was capital arriving and leverage leaving. USDT supply jumped 31.78% over the week, from $387M to $510M, and the supply rate fell 8.42% as fresh deposits outran borrow demand. WETH said the same thing more pointedly, where deposits rose 8.24% while the rate slipped 2.14%. WBTC deposits climbed 6.70%, yet the rate stayed pinned, BTC parked with no one bidding to borrow it. USDC was the lone exception, its rate up 1.29% as deposits drained 5.53%. We’re seeing deposits in, borrow demand soft, rates down, which is the onchain signature of deleveraging.
Capital flowed along event lines this week, as Ethereum led with $253M of net inflows, helped by positioning around the Glamsterdam upgrade, which the Ethereum Foundation has confirmed slips from June to Q3 with a 200M gas-limit target. Arbitrum was the standout at $97M, on two concrete catalysts. LG Electronics launched an onchain advertising pilot built on an Arbitrum custom L2, aimed at fraud in the $679bn digital ad market and its base of 216M smart TVs, and a DAO funding vote was live at the same time. The outflows were just as specific. Solana shed $216M as spot SOL ETFs bled and treasury holders sold, with SOL trading under $70, and Base lost $60.6M. The week rewarded chains with a story and punished those without one.
Tokenised real-world assets added 3.57% in aggregate, but the gains sat almost entirely in private credit. Centrifuge led with 18.13% and Maple rose 16.92%, while the tokenised-cash products lagged. Securitize up 3.75%, Ondo down 0.58% and Paxos down 1.36%. That split fits the rates backdrop. With the Treasury curve richening and bill yields easing, the high floating coupons on private credit pools screen better against tokenised T-bill products whose yields track the curve down. No single new mandate explained the size of the Centrifuge and Maple moves this week, but the direction, private credit over tokenised cash, is the cleaner read.
Our Take: The onchain tape backs up what the basis and the macro data already said, that this is a deleveraging week dressed as calm. The signal to watch is the Aave WETH and USDT borrow side, rates ticking back up on flat or rising deposits would be the first hard sign that leverage, and risk appetite, are returning.
The Vanishing Premium
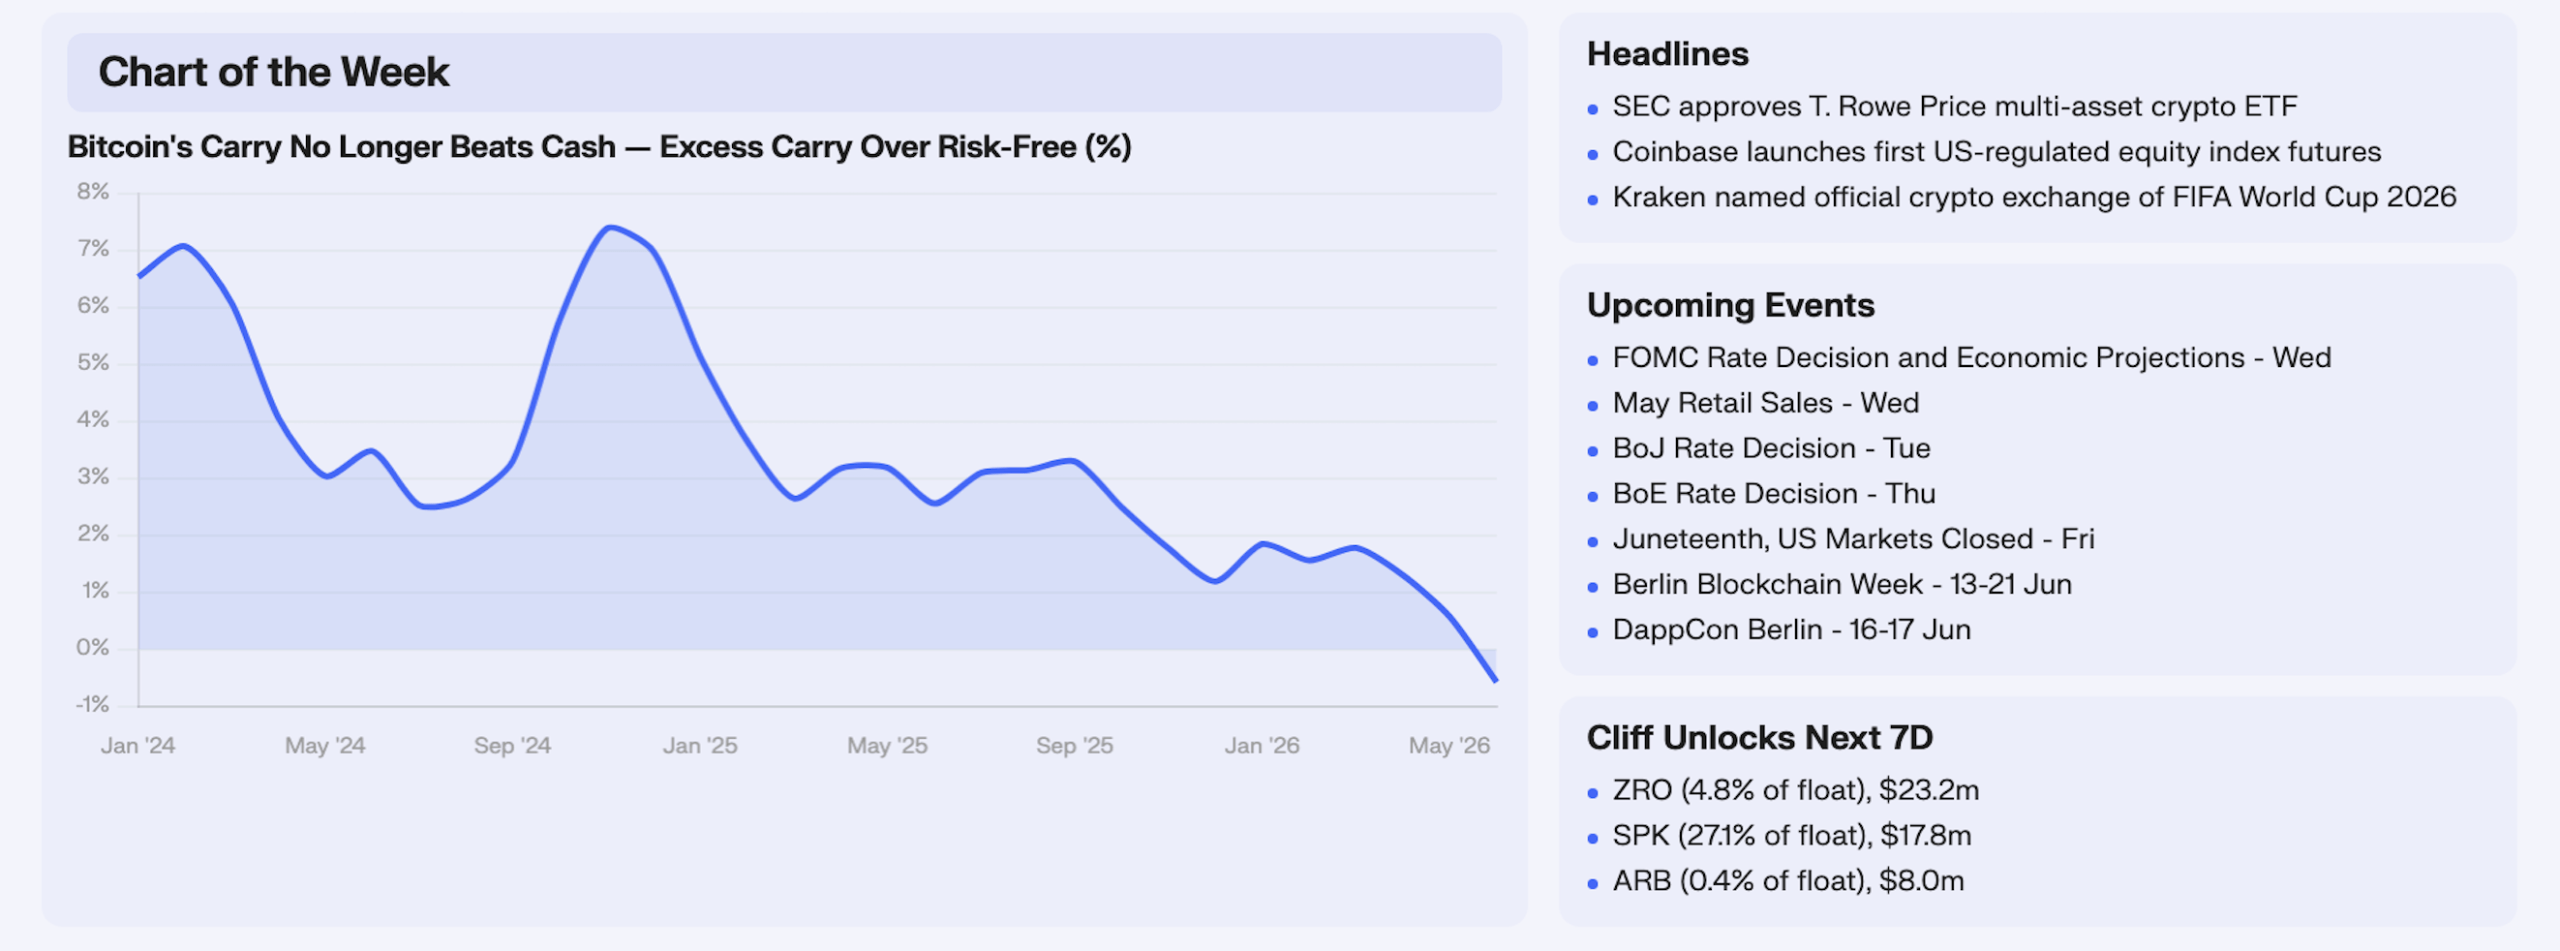
The cash-and-carry trade that underwrote a portion of Bitcoin’s institutional bid has stopped paying a premium over the risk-free rate. This week’s chart of the week plots the excess carry over the risk-free rate, which is the spread between the annualised basis and the 3-month US T-bill. That spread has collapsed from a fat 6 to 7 points through 2024 to roughly zero today. The CME annualised basis now sits near 3.2% against a three-month bill around 3.7%, so as of mid-June the carry has dipped marginally below cash, by about half a point, though that crossover is narrow and front-month-sensitive, and can re-steepen. This is a trend that’s structurally ground lower from 2024 to today, and culminated in the recent near-zero print.
The carry trade is one of arbitrage in which allocators buy Bitcoin spot, or from 2024 a spot ETF like IBIT, and short a dated CME future trading at a premium. The future has to converge to spot at expiry, so the desk banks that premium regardless of price direction. Annualise the return, and you get the basis, quoted as a yield. The cash tied up in the trade could otherwise sit in T-bills, which makes the risk-free rate the floor hurdle, and the simplest test of the trades attractiveness to allocators. For a levered desk the bar is higher still once CME margin financing, balance-sheet cost and the ETF leg’s ~0.25% fee come out, so the economics die well before the gross basis even touches the bill. The 6-7 point excess is what pulled capital into the structure through 2024, however its disappearance is what pushes that capital back out.
CME futures open interest hit a 14-month low around $8.4b in April, and total Bitcoin futures OI has fallen to roughly $42.6b from a $90b-plus October peak, while perpetual funding has drifted to neutral rather than deeply negative. Shrinking OI with neutral funding is the tell of hedges being removed, as opposed to fresh directional shorts piling in, and that is deleveraging rather than a liquidation cascade. Of course, this is a read as opposed to hard fact. Our read will be invalidated if funding flips sharply negative or OI starts building on new shorts, however neither has happened yet. The bigger question becomes what kind of demand is actually leaving. A fat basis structurally manufactured a rate-sensitive portion of institutional ETF buying that looked like conviction but was really rates arbitrage. The hard number behind that claim is the 13F data, in which hedge funds’ share of Bitcoin-ETF assets fell from 41% to 32% over the past year per CoinShares, a rate-sensitive cohort shrinking as directional holders grew. The recent outflows are not themselves proof of an arb unwind, to be clear. NYDIG examined the single largest IBIT block in the window, about $1.26b on the 26th May, and judged it a directional exit with no matching CME leg. How much of the leaving demand is carry versus ordinary selling won’t be confirmable until Q2 13Fs land in mid-August.
Our Take: The basis is Bitcoin’s implied financing rate, the market price of leveraged long exposure expressed as a yield, and it now sits below the dollar’s own financing rate. That tethers crypto risk appetite directly to the Fed. While bills pay 3.8% and the basis pays less, the carry stays dead independent of any view on spot, and the synthetic bid stays absent. So the level to watch is not Bitcoin’s price but the spread itself. A sustained re-steepening of the basis back above the bill would signal leveraged-long demand returning, and historically that has accompanied trend resumption. Continued compression says a non-trivial part of 2024-25’s adoption was financing-sensitive and reversible. The honest falsification date is mid-August, if the Q2 13Fs show the hedge-fund cohort stabilising rather than shrinking further, the carry-demand thesis weakens. Until then, we will be watching the spread and ETF net flows for further signal.
Join our Telegram Channel to get it delivered directly to your phone.

Stay up to date
Get the latest industry insights, in-house research and Keyrock updates.
This site is protected by reCAPTCHA and the Google Privacy Policy and Terms of Service apply.