

6 July 2026
Key Insights: Hike Odds Fade
Hike Odds Fade
Every Monday, we deliver a concise yet comprehensive briefing to help you navigate the week ahead.
Our weekly market dashboard brings together key insights across Macro, Crypto, and Onchain activity, distilled into a clear, actionable format. Whether you’re managing risk or spotting opportunity, start the week informed and aligned.
Join our Telegram Channel to get it delivered directly to your phone.
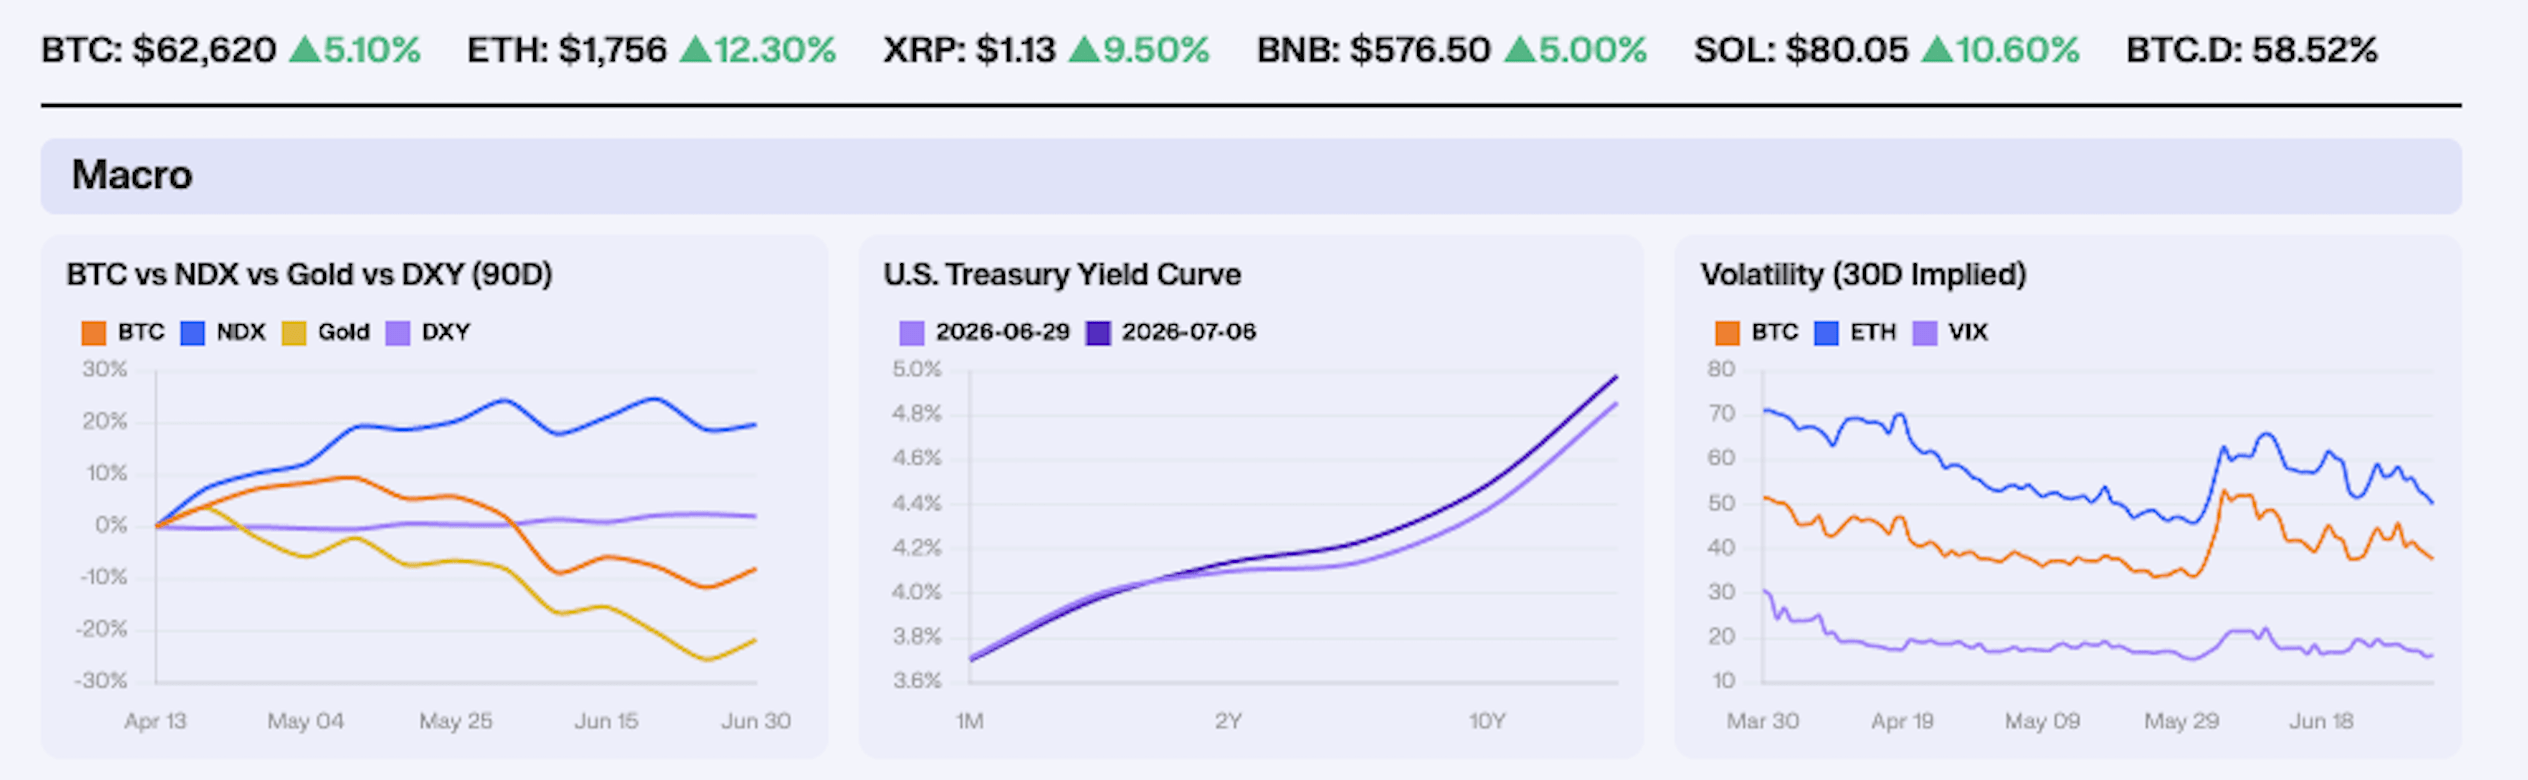
Risk assets and inflation hedges bounced together after a labor print that took air out of the September hike trade. June payrolls added only 57,000 jobs on Thursday, less than half the consensus near 110,000, with April and May revised lower by a combined 74,000. BTC gained +5.9% to $63,589 and gold rose +2.46% to $4,162 as the dollar eased -0.43% to $100.74, reversing the cross-asset pattern from last week when both Gold and BTC sold into hot May PCE. The Nasdaq added +0.72% to 29,329, a modest firming after the semiconductor unwind that had dragged the index -4.24% the prior week.
Yields bear-steepened even as the jobs miss pulled near-term hike odds lower. CME FedWatch now prices roughly a 55% chance of a September hike, down from about 64% before the release and near 80% at last week’s close, with July hold odds still above 60%. Chair Warsh, speaking at the ECB forum in Sintra on Tuesday, said inflation risks had eased over his first four weeks in office but warned anyone expecting tolerance above 2% would be disappointed, leaving the long end to trade the mix of softer labor and unchanged inflation discipline.
Volatility compressed sharply into the relief move. BTC 30-day implied vol fell -17.5% to 37.7, ETH IV dropped -14.3% to 50.2, and the VIX slid -13.2% to 16.2, reversing most of the cross-asset vol lift from the prior week’s drawdown. On Deribit, BTC options open interest sits at 340,641 contracts at a 0.56 put-call ratio, with July $55,000 puts marking near 45 vol against 35 vol on $65,000 calls, so downside skew remains rich even as the at-the-money surface came in. For investors who think this recent price jump won’t last or stay for some time, selling call options (covered calls) is a possible way to lock in profits and pocket extra income from the current market volatility.
Our Take: The market delivered the signal we flagged last week, a softer macro print that fades the September hike enough for Bitcoin and gold to recover together. The bounce is relief pricing, not a clean macro all-clear, with the long end still within a dozen basis points of 5% and roughly half the September hike still on the table. Thin holiday liquidity and ongoing ETF outflows argue the move has more short-covering than fresh institutional demand behind it. The confirmation we watch is whether September hike odds break below 50% after the July 28 FOMC, since that is what reopens the rate-cut optionality every sustained BTC recovery has needed this year.
Short Squeeze Relief
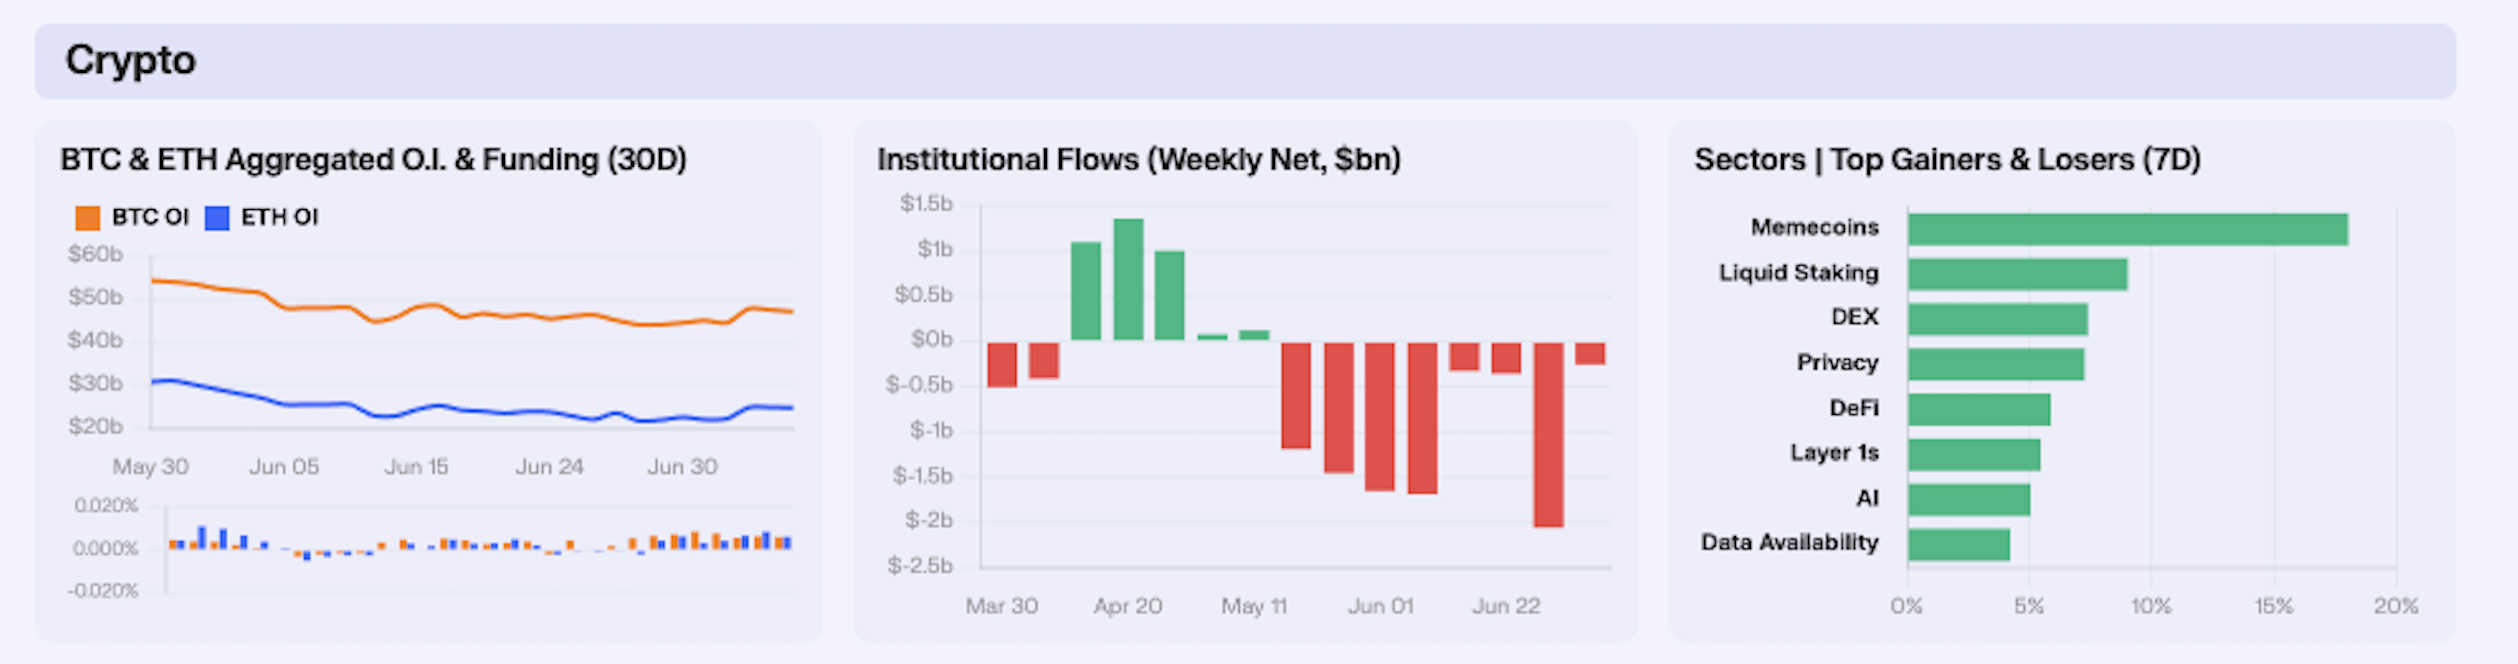
Open interest rebuilt into the bounce as spot recovered off last week’s lows. BTC open interest rose +6.9% to $47.13B and ETH open interest added +13% to $24.71B, with the build concentrated from Tuesday through Friday as price held above $60k. Funding stayed positive on both through all five sessions, with BTC funding peaking at +0.0087% on Friday and ETH funding running between +0.0033% and +0.0087%. The shape is leveraged longs returning alongside a short squeeze, with $281M in bearish liquidations over the 24 hours to Friday against $159M in longs, and ether accounting for the larger share of wiped shorts at roughly $157M versus $103M on Bitcoin.
Spot ETF outflows slowed sharply but did not turn. Bitcoin funds shed -$231M for the week against -$357M the prior week and more than -$1.4B in late May, while Ethereum products lost -$29.9M and Solana funds eked out +$5.5M. The redemptions are still running, but the pace is the lightest since the drawdown began, which fits a market where perp traders are leaning long into a macro relief move while the spot complex continues to redeem at the margin. We read the gap as positioning leading spot again, the same divergence that defined the prior two weeks, but with the perp side now pressing into a squeeze rather than adding into a falling tape.
Sectors turned broadly green for the first time since mid-June, though the dispersion still favours single names over clean category trades. Layer 1s gained +5.47%, led by ETH +9.8% and SOL +7.1%, with BTC +4.6% lagging the alt complex on the bounce. Privacy led the thematic board at +7.26% on ZEC +12.1%, while liquid staking added +9.10% as ETH beta worked. Memecoins printed +18.02% on the category screen, but the read is a single-name outlier at M +136.4% rather than broad meme rotation, with DOGE +4.5% and PEPE +14.1% moving in line with the wider market. Data availability gained +4.23%, dragged at the margin by UB -10.2% even as NEAR +6.4% held up.
Our Take: The week’s positioning is a relief rally built on forced short covering, not a spot bid turning positive. Open interest and funding both rebuilt into the move while ETF outflows continued, just at a slower pace, and the alt complex outran bitcoin as liquidity hunted beta. The test into next week is whether ETF flows stabilise after the holiday-shortened session, since perp-led squeezes without a spot turn have reversed quickly through this drawdown.
Maple Plugs Into Robinhood
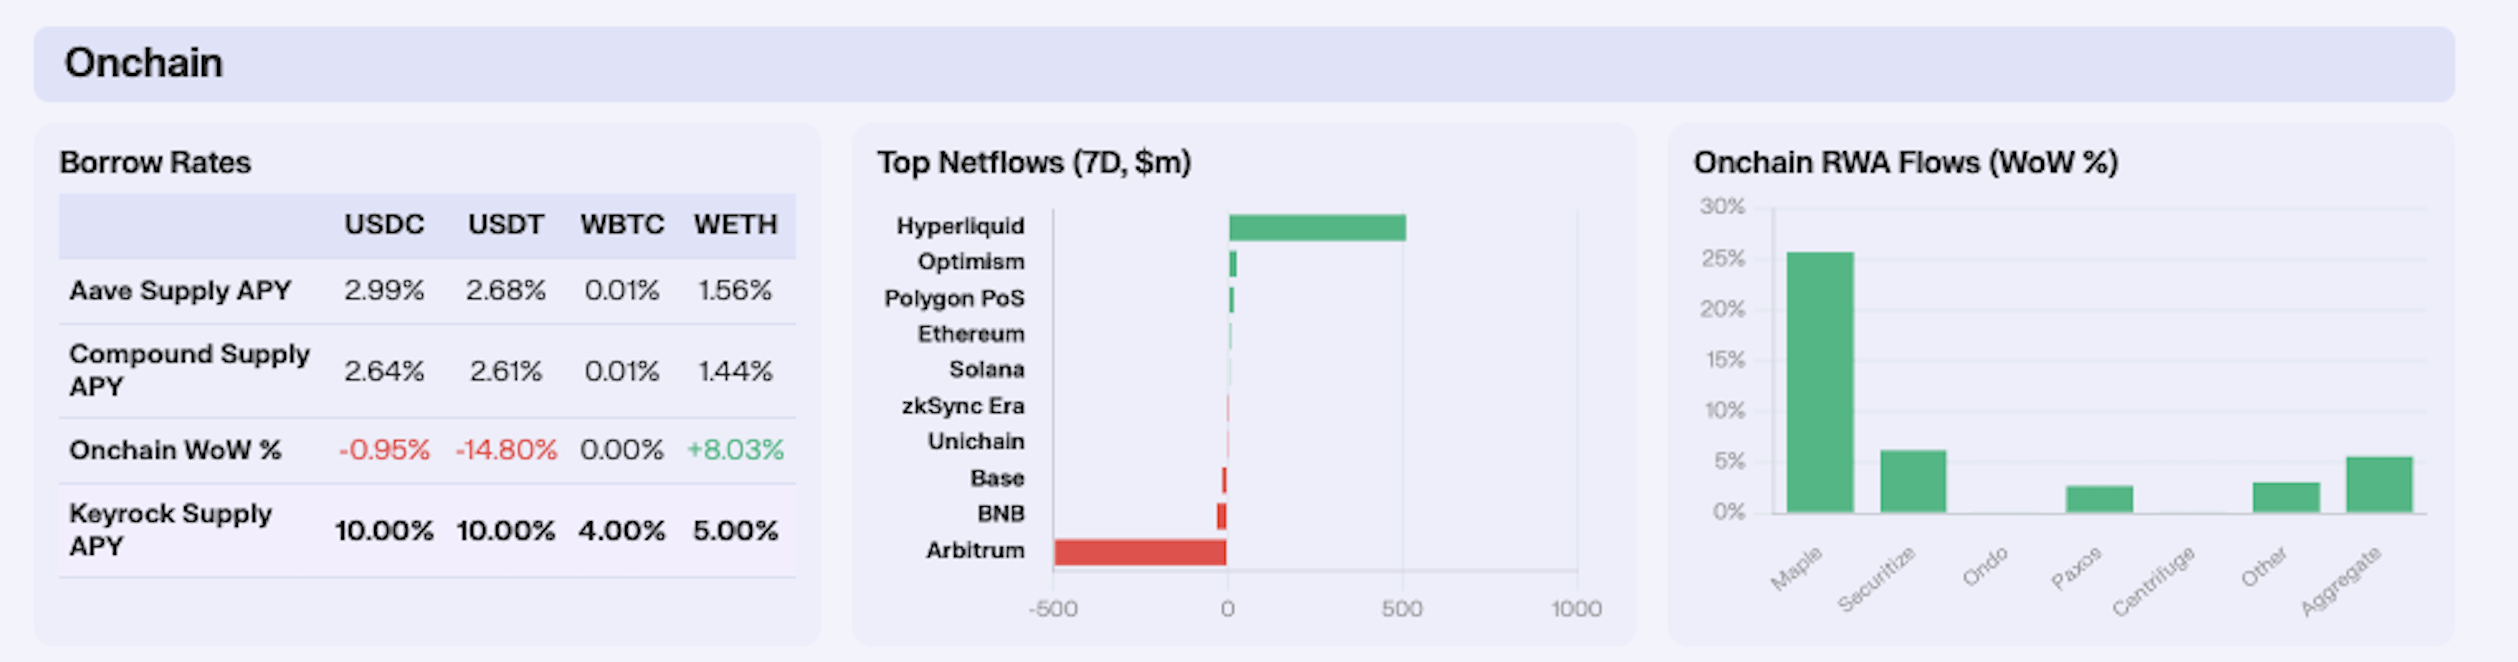
Aave’s stablecoin curve barely moved at the headline level, but the flows underneath are clear once you back demand out of the supply and rate changes. USDC supply jumped 22.69% WoW, yet the rate slipped just 0.95%. A near-flat rate against a supply surge that big indicates borrowing demand grew almost in step, roughly +21%. USDT was the opposite, and more violent. Supply contracted 35.94%, and the 2.68% rate still fell 14.80%. For the rate to drop while the pool shrank, borrowing demand had to fall faster than supply, so borrowers led the exit in a demand-driven deleveraging. WBTC stayed pinned at 0.01% with supply up 6.49% to $1.952B, confirming there is still no borrow demand for Bitcoin onchain, only collateral accumulation. WETH supply fell 3.85% while the rate rose 8.03%, so utilisation climbed and borrowing firmed against a shrinking book. Leverage is returning against ETH.
Hyperliquid pulled in +$509M of net flows while Arbitrum shed -$494M, a symmetry too neat to take entirely at face value. Most of it is structural, Hyperliquid is retiring its legacy Arbitrum USDC bridge in favour of natively minted USDC via Circle’s CCTP, so collateral that once transited or parked on Arbitrum to reach the venue is being re-based natively, mechanically draining one chain and crediting the other. It lands on top of Arbitrum’s own multi-month bleed, with DeFi TVL down roughly 55% YTD and stablecoin supply falling from $7.7B to $4.4B since May. Momentum did the rest, as Hyperliquid’s cumulative revenue crossed $1B on the 30th June and its spot ETFs took $111M into end-June while Bitcoin and ETH products bled.
RWA AUM added a strong +5.62% WoW to roughly $32.4B, but the number that mattered was Maple’s +25.75% jump, a sharp reversal from -3.75% the prior week. Our desk reads it as three catalysts fired at once, (i) Maple closed a first of its kind onchain warehouse facility with Kraken on the 25th June, (ii) launched syrupUSDG with Paxos, and (iii) went live as the credit backend for Robinhood Earn on the 1st July, pushing AUM to a roughly $5B all time high. The read across is bigger than the print, with an onchain credit protocol that is now the plumbing behind a mainstream US brokerage’s yield product, across some 24M funded accounts. Securitize added 6.21% on BUIDL strength, helped by its NYSE debut on the 2nd July as SECZ, becoming the first company to tokenise its own stock on listing day.
Our Take: The tape split in two this week, and the more interesting half is not the one lending desks usually watch. The real capital formation happened in the RWA rails. Maple becoming Robinhood’s credit engine is a louder risk on signal than any borrow rate, because it moves onchain private credit off crypto-native desks and into regulated retail distribution. Two things to watch into mid-July. First, whether Maple holds its $5B high or hands it back once launch week flows settle. Second, the GENIUS Act rulemaking deadline on the 18th July, which sets the compliance perimeter for exactly the USDG and BUIDL rails that carried this week’s RWA move. If those rules land issuer friendly, the Maple-Robinhood template gets copied fast.
The $10B Card Mirage
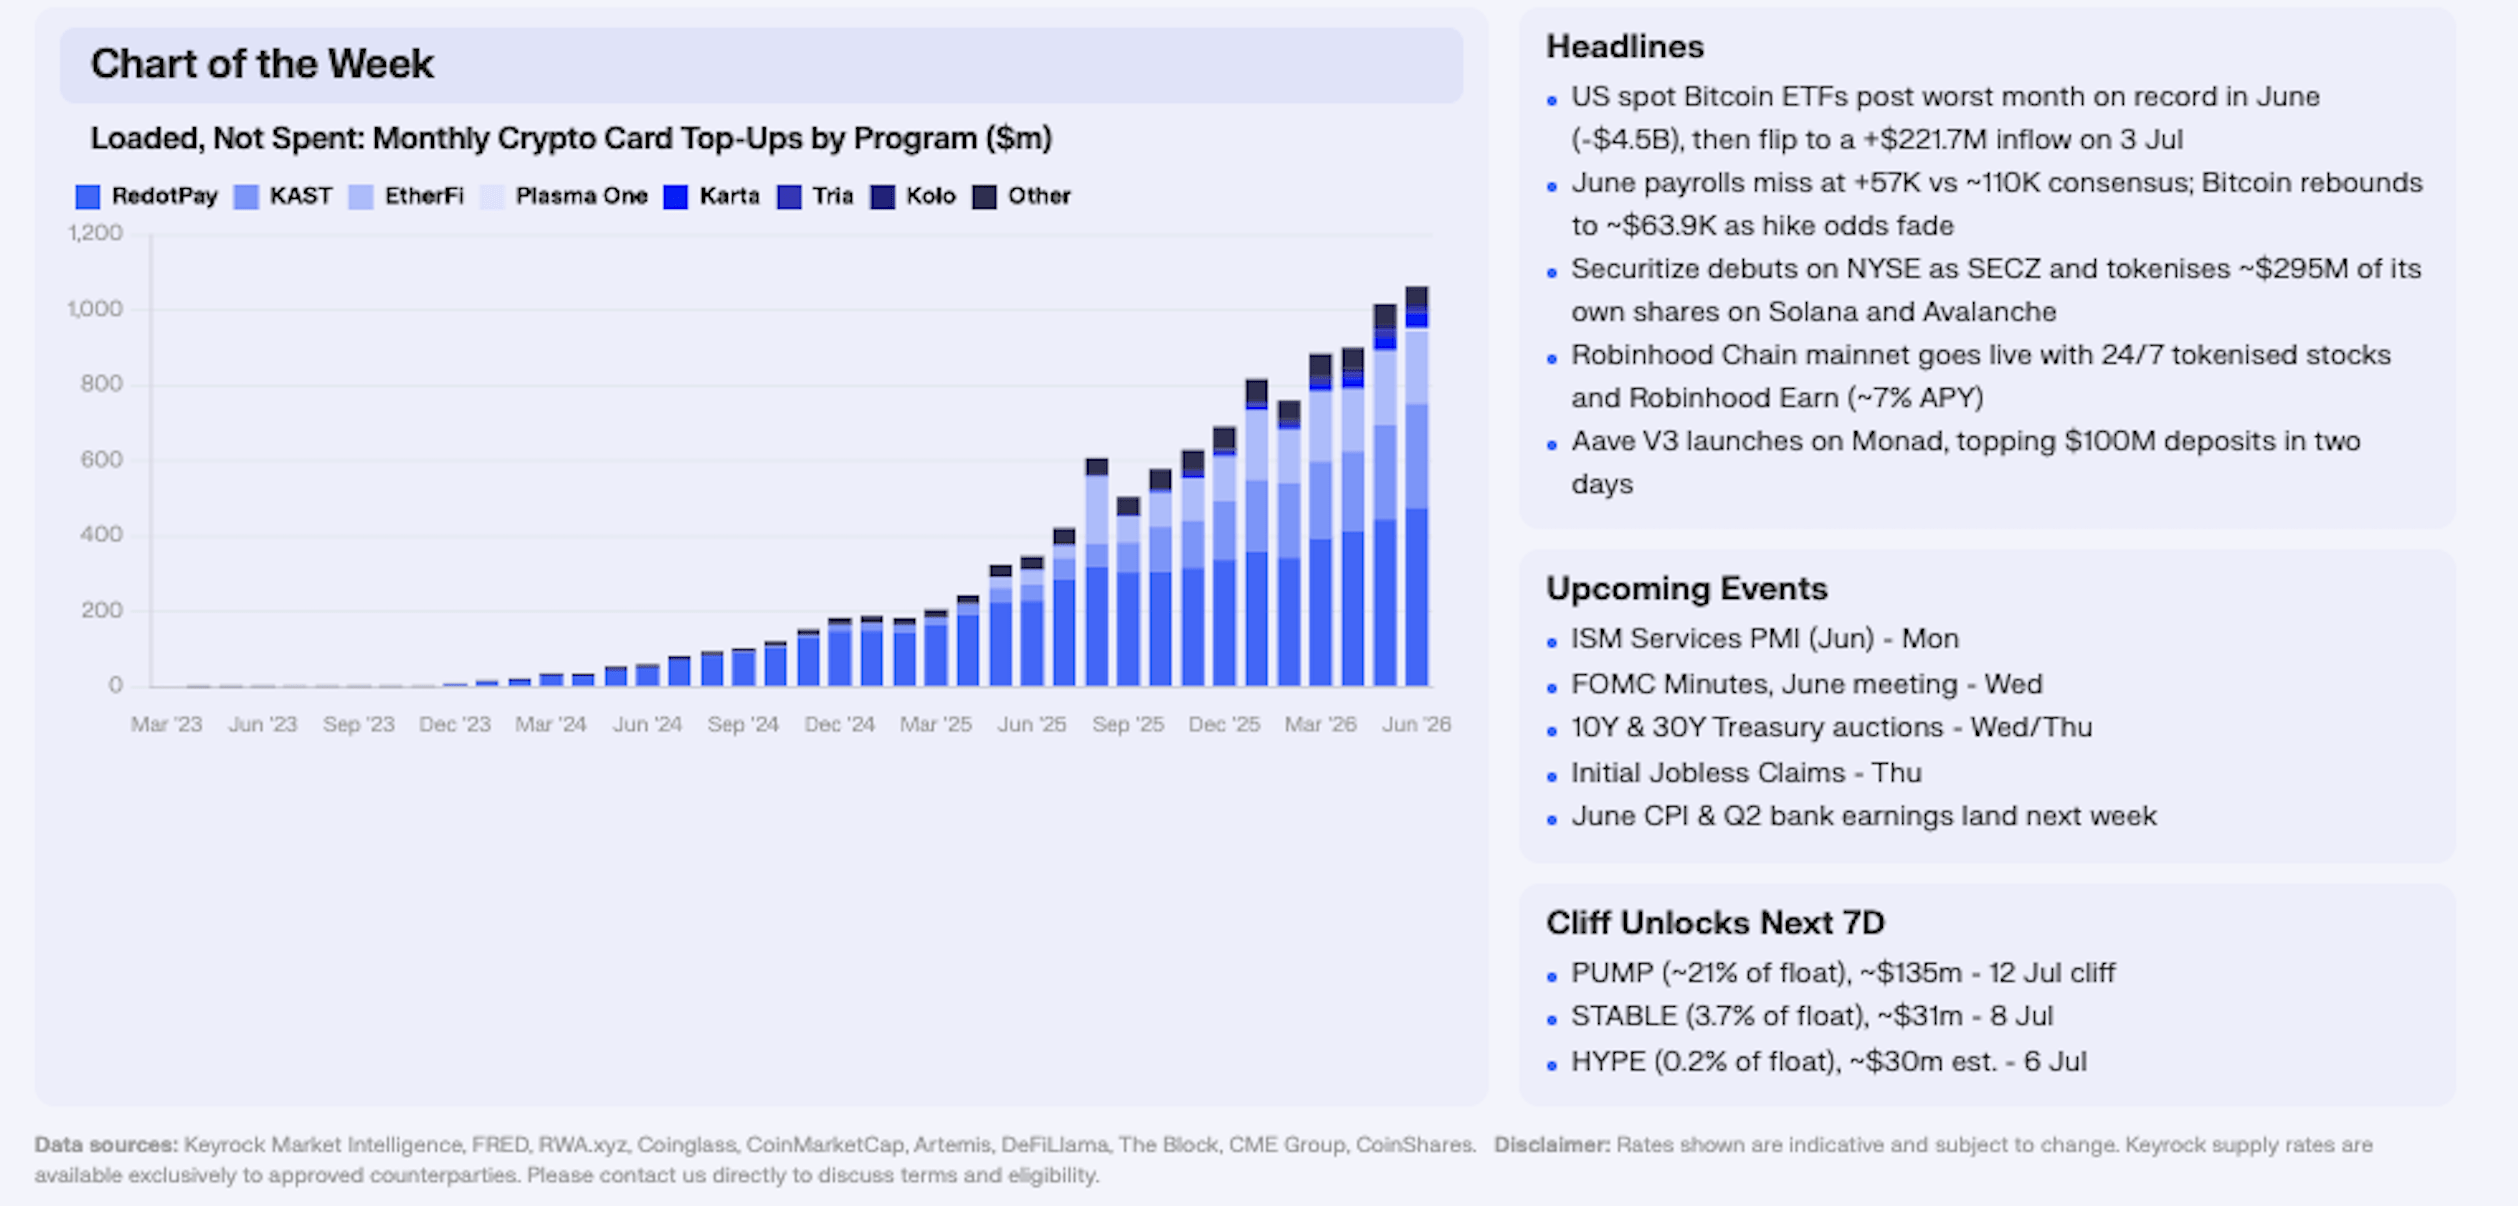
Monthly crypto card top up volume has gone from roughly $9.5M in late 2023 to about $1.06B in June 2026, a 110x climb in under three years, on Paymentscan’s onchain tracking across 19 chains. Cumulative top ups now sit at $10.44B across nearly 25M transactions and 1.7M addresses. RedotPay built the category almost single handedly, with $6.31B of lifetime volume and around 1M users, and it still tops the table at $475M last month. But the stack has broadened, with KAST having scaled to $214.6M a month and $1.65B lifetime, EtherFi’s card to $107M, and a long tail of wallet native and neobank programs now filling in beneath them. The curve is a clean hockey stick, and it is the most tangible evidence yet that stablecoins are being loaded onto Visa and Mastercard rails at scale.
The thing to handle with care is what “volume” measures. This is top up volume, money loaded onto a card program, not merchant spend, and once you look at the per program fingerprints a good chunk of it clearly isn’t retail. Karta shows $173.2M of lifetime volume across just 352 transactions and a single registered user, an average ticket near $492K. Kolo reports five users, Tuyo and Solflare one apiece. Tickets in the hundreds of thousands against single digit user counts are the signature of B2B, treasury, or white label settlement riding card rails, not people buying coffee. Set that against RedotPay’s $853 average ticket over 7.4M transactions and a million users, which is what real consumer spend looks like, and the dataset is plainly two very different activities.
The gap shows up in the cross checks, where McKinsey puts stablecoin card-linked spend at roughly $4.5B for 2025, against Paymentscan’s $10.44B of cumulative top ups, so real merchant spend is plausibly half the headline or less. Paymentscan’s own caveats point the same way, with about 20% of RedotPay top ups happening offchain and are excluded, and up to 10% of onchain top ups are remittances rather than card payments. Even at face value the category is tiny next to the incumbents, roughly 0.07% of Visa and Mastercard’s combined $27T of throughput. It is a more meaningful 2-3% of the roughly $390B in genuine stablecoin payments, and it is compounding faster than any of them at north of 100% a year.
Our Take: The chart is real, but it is not the clean consumer adoption story it looks like at a glance. Strip out the B2B settlement and remittance flow and a large share of this card volume is stablecoins moving between businesses that happen to use card infrastructure as the rail. That is arguably the more interesting outcome. We believe that the spread between top ups and actual merchant spend is the thing to watch. If programs like Karta keep adding hundred thousand dollar tickets on a handful of accounts, the growth is institutional plumbing. However, if RedotPay and KAST keep compounding millions of small tickets, it is real consumer reach. Paymentscan’s spend view, set against this top up view, is where that answer shows up first.
Join our Telegram Channel to get it delivered directly to your phone.

Stay up to date
Get the latest industry insights, in-house research and Keyrock updates.
This site is protected by reCAPTCHA and the Google Privacy Policy and Terms of Service apply.