

Designing Token Buybacks
Written by Amir Hajian
Key Insights
- Tokenholder revenue is accelerating: Revenue returned to holders through buybacks and direct distributions has surged over 5x since 2024.
- Protocols are prioritizing payouts over reinvestment: Across 12 protocols, teams on average directed 64% of total revenue to holders, compared with traditional DAOs that allocate most spending to product, growth, and community.
- Many revenue-share programs draw from treasuries: Most protocol revenue distributions are still funded by existing reserves rather than recurring cash flows when accounting for product and growth costs.
- Buybacks reflect maturity: Mature projects usually launch buybacks once their token trades at higher revenue multiples, while newer protocols use them earlier to attract users and visibility.
- Buybacks are broken, but can be improved: Programmatic buybacks often overspend at market peaks and underspend in downturns, when they matter most. Our adaptive buyback models in this report try to address this by allocating more in downturns and less in peaks, promoting disciplined, efficient capital use and treasury preservation.
- Spreading buybacks builds stability: Spreading buybacks over time instead of doing them all at once makes value delivery steadier and more predictable, helping reduce price swings and provide more stable returns to holders.
- Projects can earn revenue while buying back: Options-based buybacks let teams generate revenue ahead of repurchases while smoothing entries through laddered pricing.
- Most projects use taker orders for buybacks: Taker-based buybacks remove liquidity and can amplify volatility, especially in thin markets. Using maker orders instead helps deepen order books and dampens volatility.
- Teams should align buybacks with organic volume: Calibrating activity to genuine trading activity allows buybacks to blend into natural market flow and optimises average execution price.
Introduction
Token buybacks are rapidly becoming a central lever in how protocols think about value distribution. Still, their rise has sparked debate over timing and trade-offs, particularly given that most crypto protocols remain in their growth stage. Critics argue that diverting revenue to buybacks too early can be an inefficient use of capital. Every dollar spent on repurchasing tokens is a dollar not spent on growth, marketing, or product development.
This debate is less pronounced in equities, where company performance is more transparently linked to shareholder value and many external factors (e.g. market sentiment). Metrics like earnings per share, dividend policies, and disclosure requirements provide investors with measurable indicators of corporate performance and governance standards. Even without buybacks, shareholders have a clearer framework for how company fundamentals may ultimately accrue to ownership value. Public companies also typically reach a certain scale and valuation before listing, meaning buybacks tend to occur once firms can justify have the scale and stability to justify capital returns.
In crypto, such mechanisms are largely absent. Tokens do not guarantee dividends, confer legal rights, or offer the clarity of earnings metrics. The link between protocol performance and tokenholder value is therefore indirect and often uncertain. In this context, buybacks take on outsized importance as one of the few credible ways a protocol can signal alignment and deliver value back to its holders.
Much like public companies that use buybacks to signal long-term commitment and instill investor trust, crypto teams leverage them to enhance token value and communicate conviction in the project’s future. In an environment where value accrual mechanisms remain experimental, buybacks provide a transparent way to demonstrate alignment and strengthen credibility.
Regulatory regimes have matured, with clearer frameworks emerging outside the U.S. and enforcement no longer casting the same blanket risk over distribution models. This gradual clarity has created more space for experimentation, pushing teams toward defensible designs, whether channeling protocol earnings into buybacks that remain in treasury, are burned, or distributed through mechanisms requiring active participation.
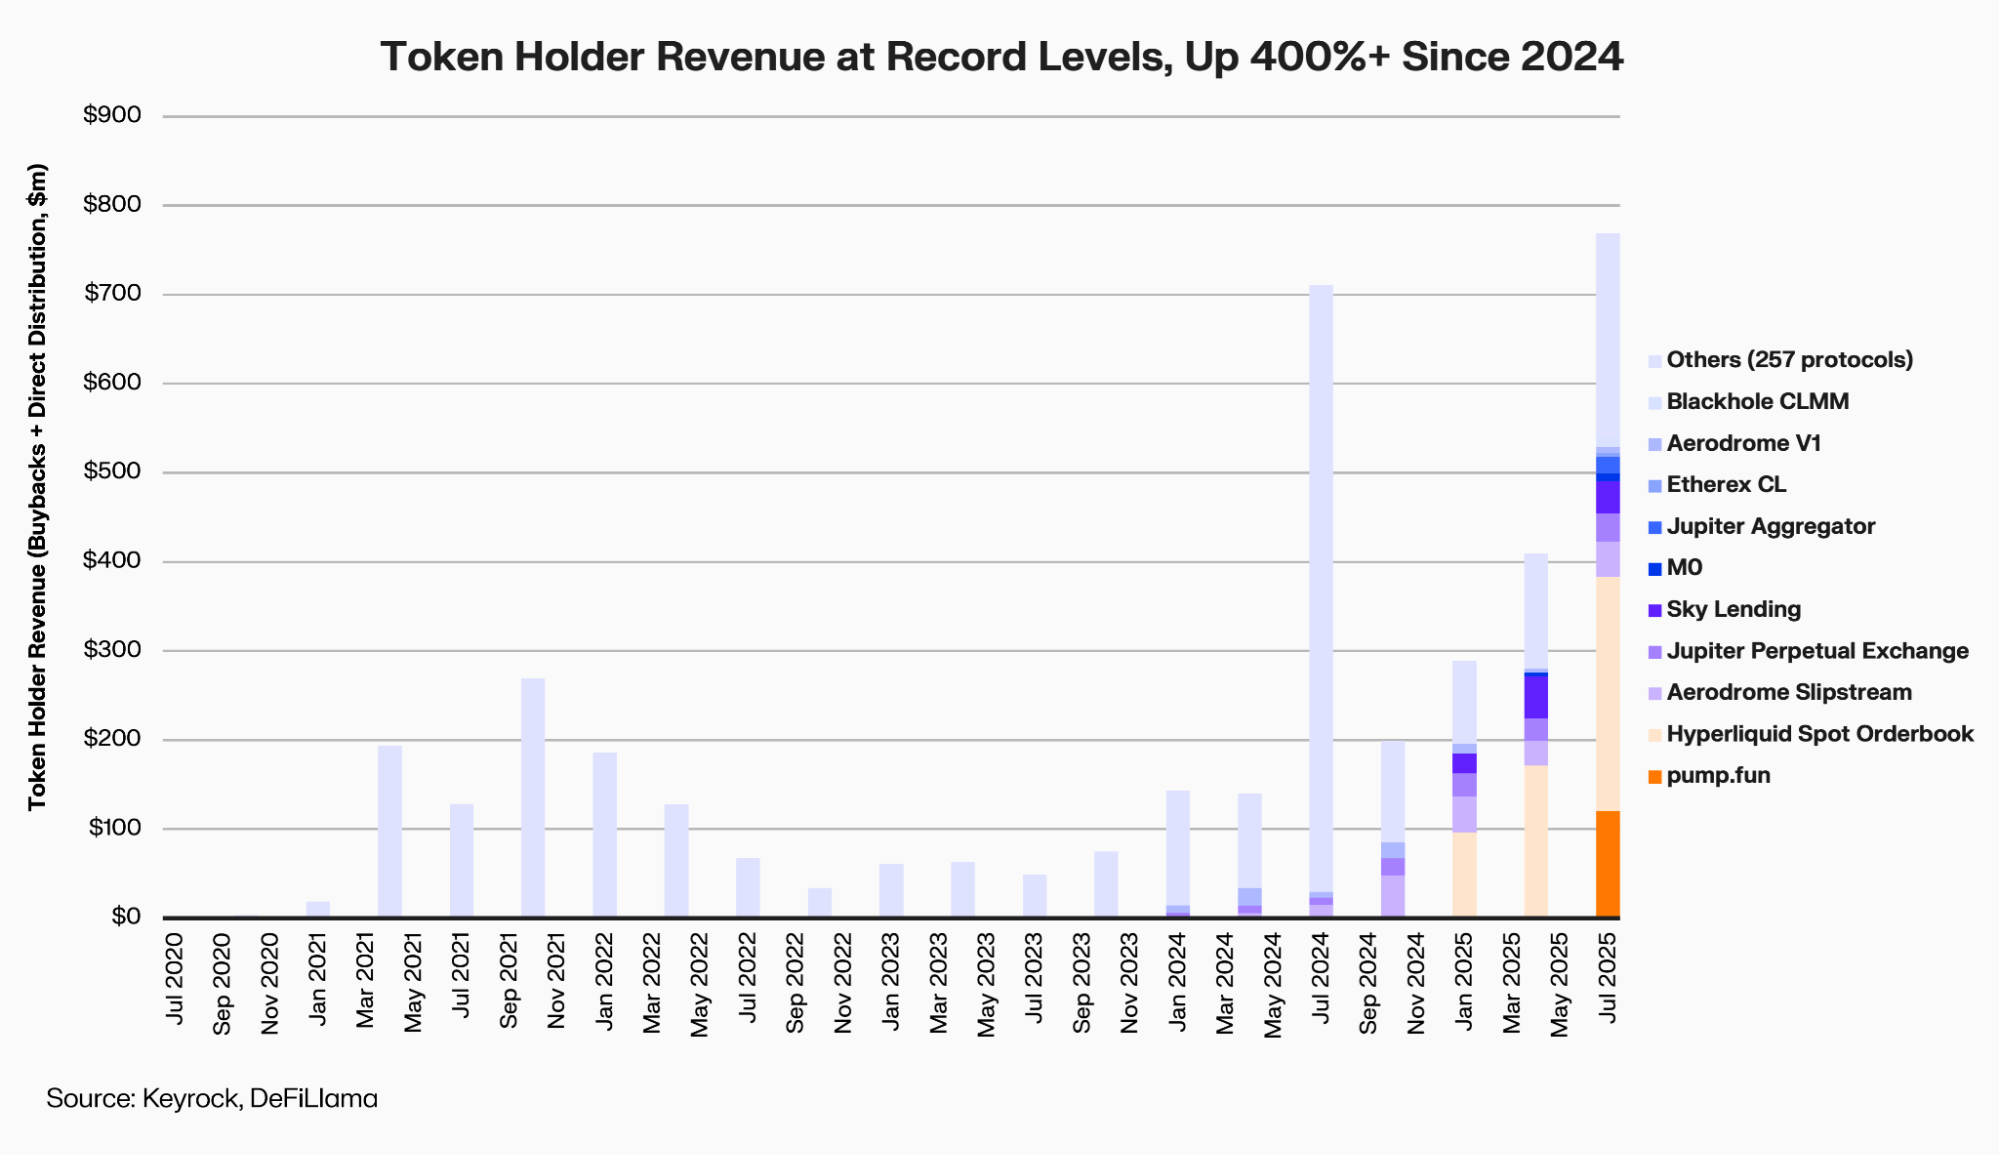
With more growth-stage protocols now generating consistent revenue, buybacks are gaining traction as a flexible tool for value distribution and alignment signaling. This shift has helped drive a more than 400% increase in tokenholder revenue since 2024, reaching record highs of nearly $800 million in Q3 2025.
This report provides a framework for evaluating token buyback programs. When teams consider conducting them, how execution methods differ, and where improvements could make them more effective. As shown in the chart below, buyback approaches evolve along a maturity curve, from no distributions at all to corporate-style treasury management These two dimensions, purpose and execution, form the core of our analysis.

The buyback outcomes presented in this report don’t occur in a vacuum. They are shaped by product adoption, token unlock schedules, and broader market dynamics. In the analysis that follows, we hold these factors constant to focus on buyback design and execution, but they remain critical caveats when comparing programs.
Framing The Buyback Decision
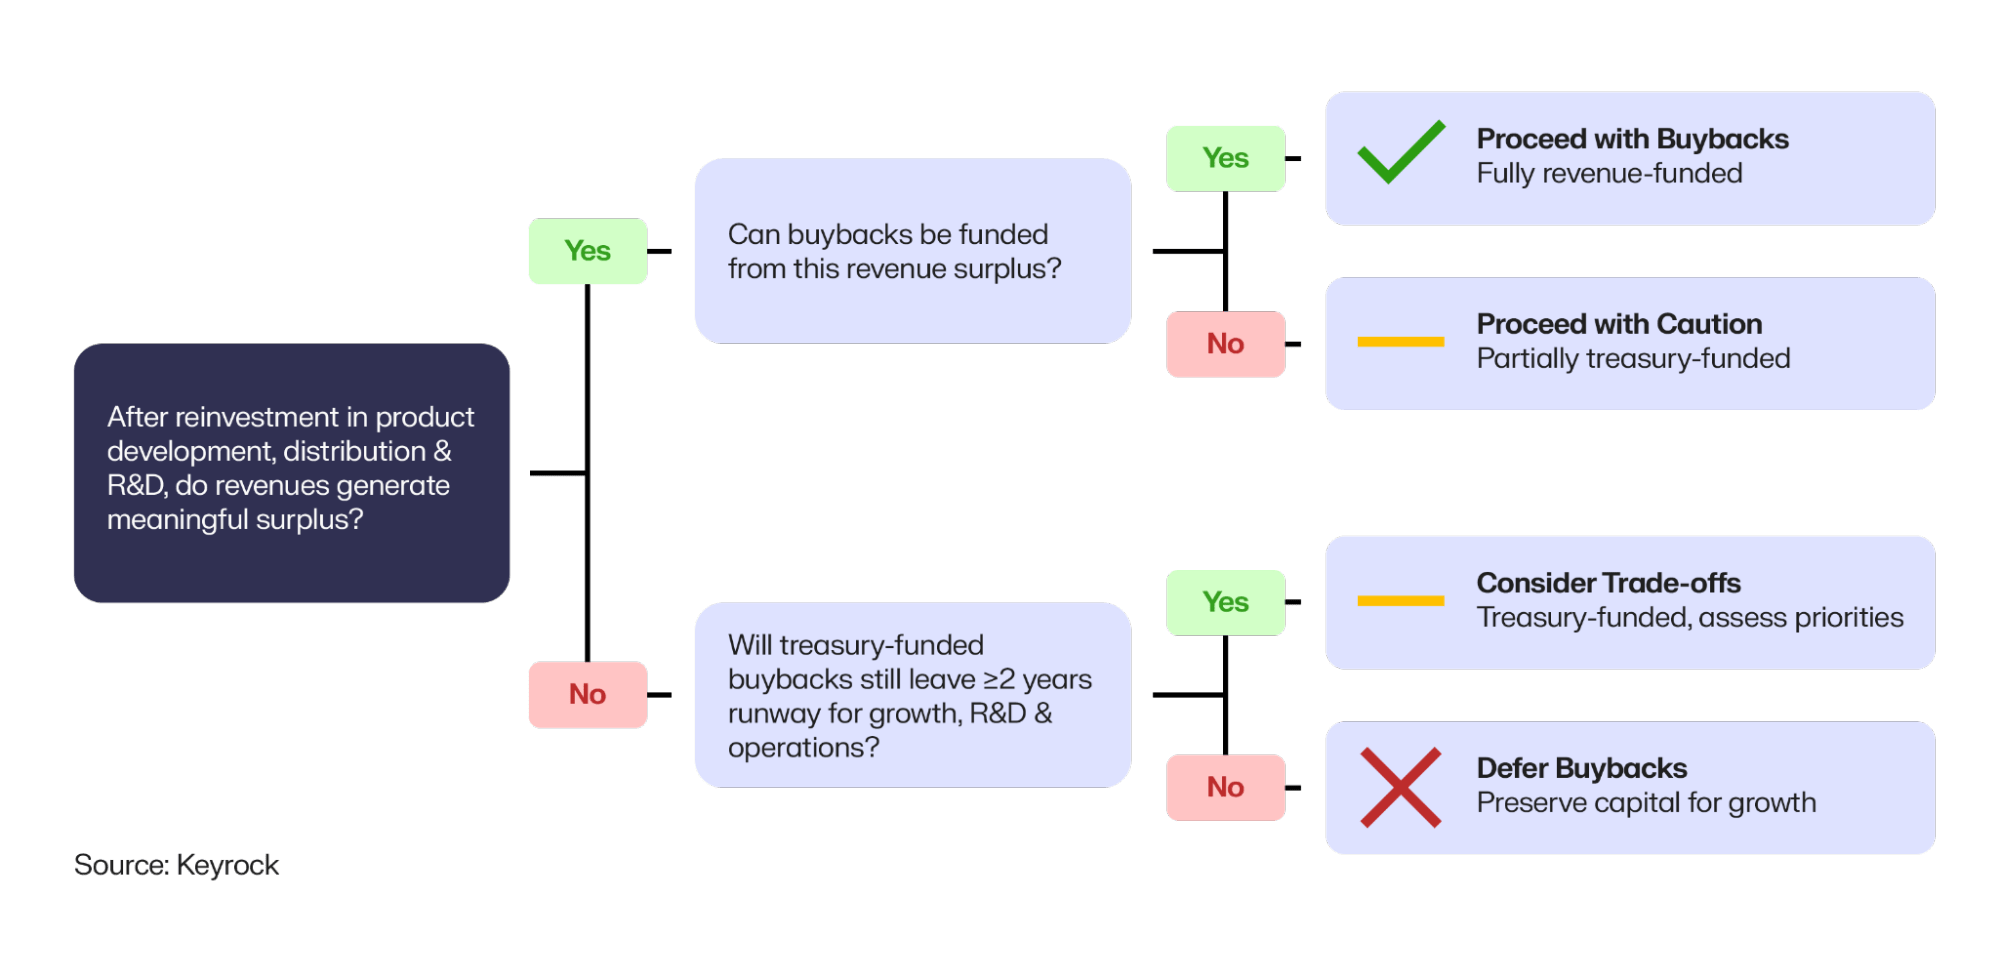
Before turning to execution, the first question for any project is whether to conduct buybacks at all. Prematurely distributing revenue can leave founders without sufficient capital to invest in product development, distribution, or R&D. As Dan Morehead of Pantera advises, “try and have two years of burn rate in the books to survive a bear market.” In practice, this means each team must weigh the strength of their balance sheet before initiating distributions.
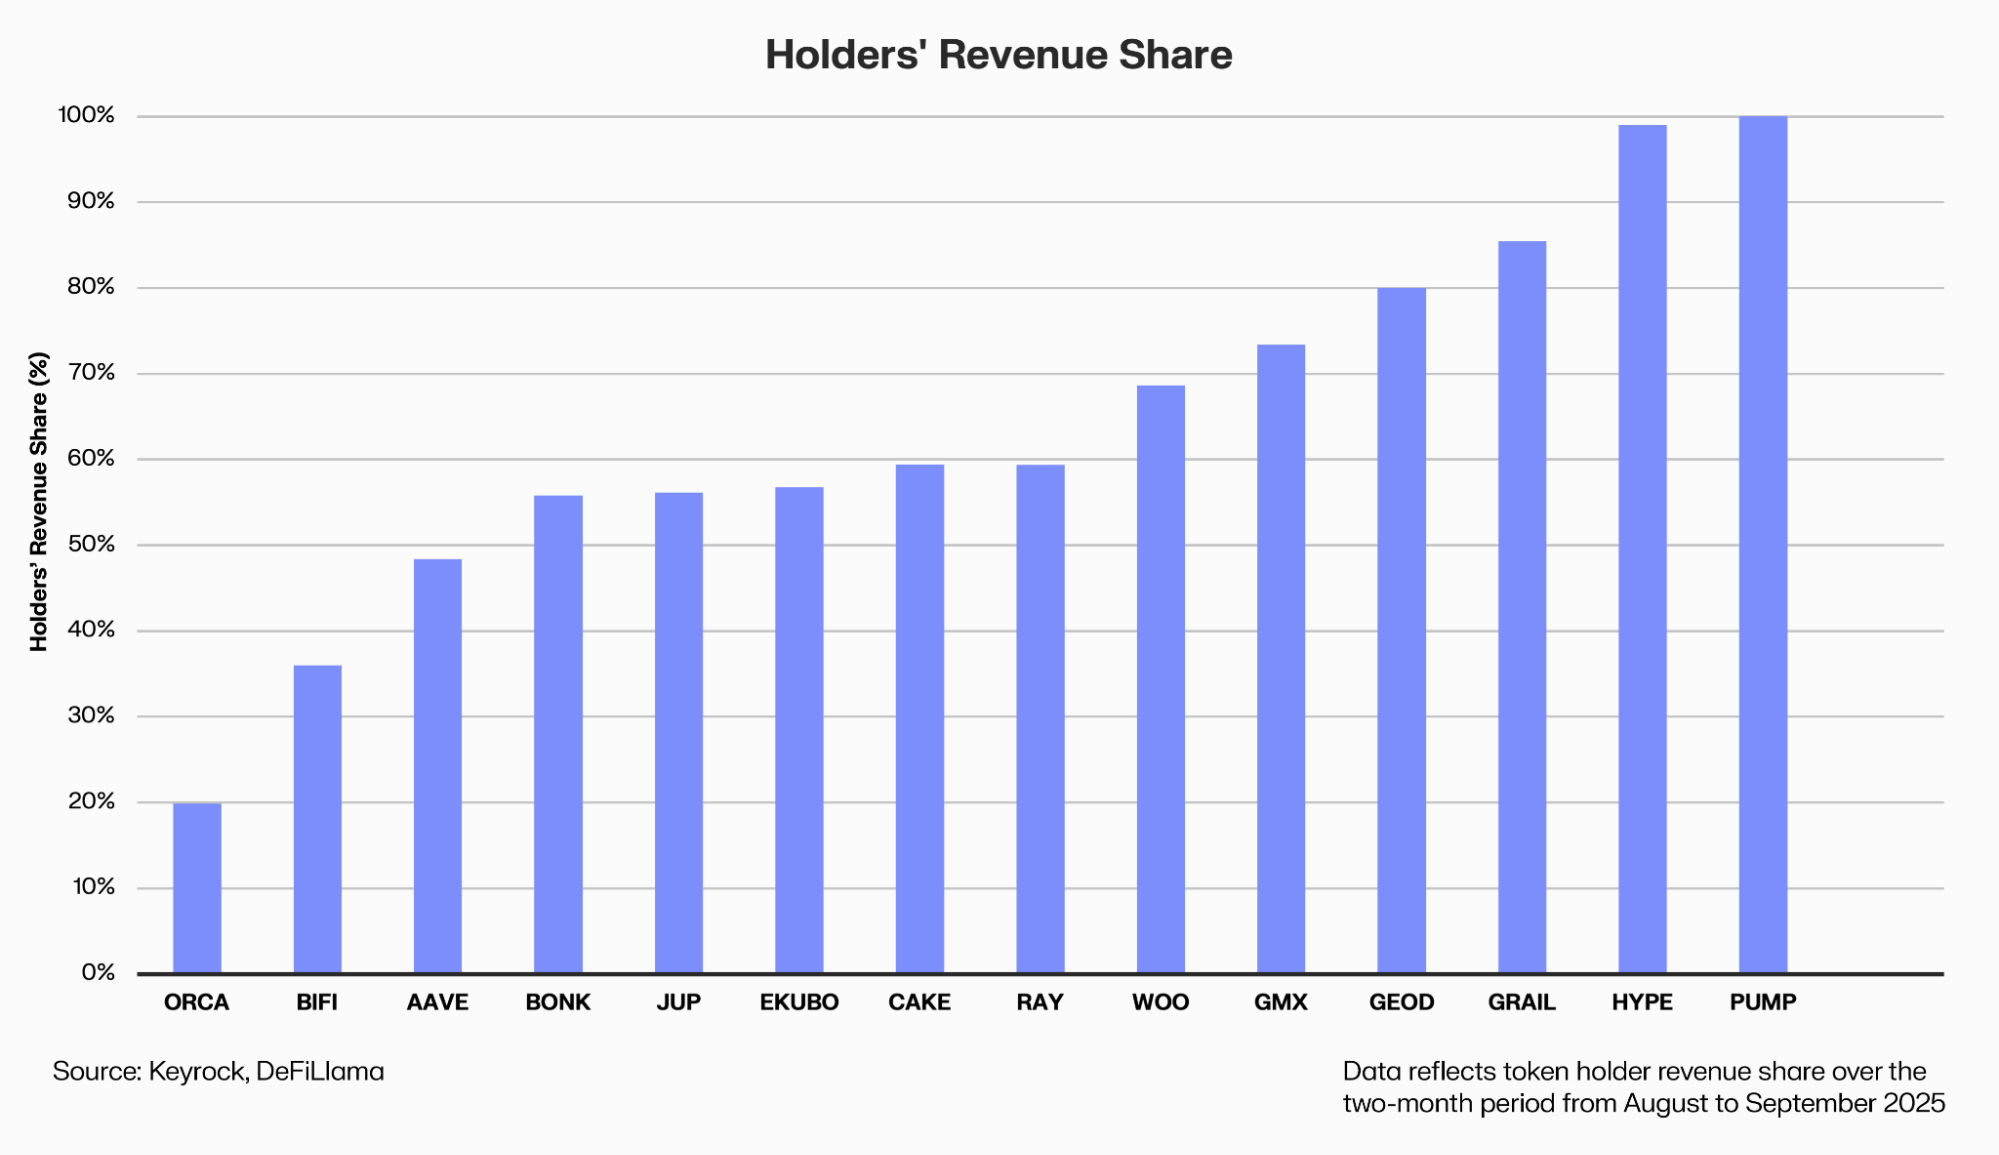
In our sample of 12 protocols that conduct revenue distributions, projects on average returned ~64% of their revenue to tokenholders through buybacks or direct payouts. By contrast, a Messari survey of 10 DAOs examined treasury spending, finding that 77% of outflows went to product and growth initiatives, with only 23% toward community, marketing, and operations, a tilt toward reinvestment rather than distribution.
The contrast highlights the trade-off between capital retention and revenue distribution, as revenue-sharing protocols tend to operate with much slimmer reinvestment buffers.
Taken together, these figures suggest that most revenue-share programs are majorly funded from existing treasuries rather than recurring revenues when accounting for product and growth costs. Teams must assess whether post-buyback reserves can support growth, R&D, and operations through market downturns, although ultimately, the key question is whether buybacks strengthen long-term resilience or simply trade future reinvestment for short-term holder returns.
Once teams determine that buybacks are justified, initiating them can help build confidence by returning value in a predictable way. To gauge whether they are meaningful once initiated, we compared the project’s adjusted market cap to annualised daily revenue over a two-month period from the start of each protocol’s revenue share program.
There isn’t a clear one-size-fits-all relationship between valuation multiples and the start of revenue sharing. However, more established projects with stronger product traction tend to initiate revenue distributions at higher valuation multiples, using them as a signaling mechanism to demonstrate financial strength.
In contrast, newer or smaller protocols (with pump.fun as an outlier) often begin distributing revenue from the onset, treating buybacks as an incentive mechanism to attract attention and bootstrap engagement in the absence of established fundamentals.
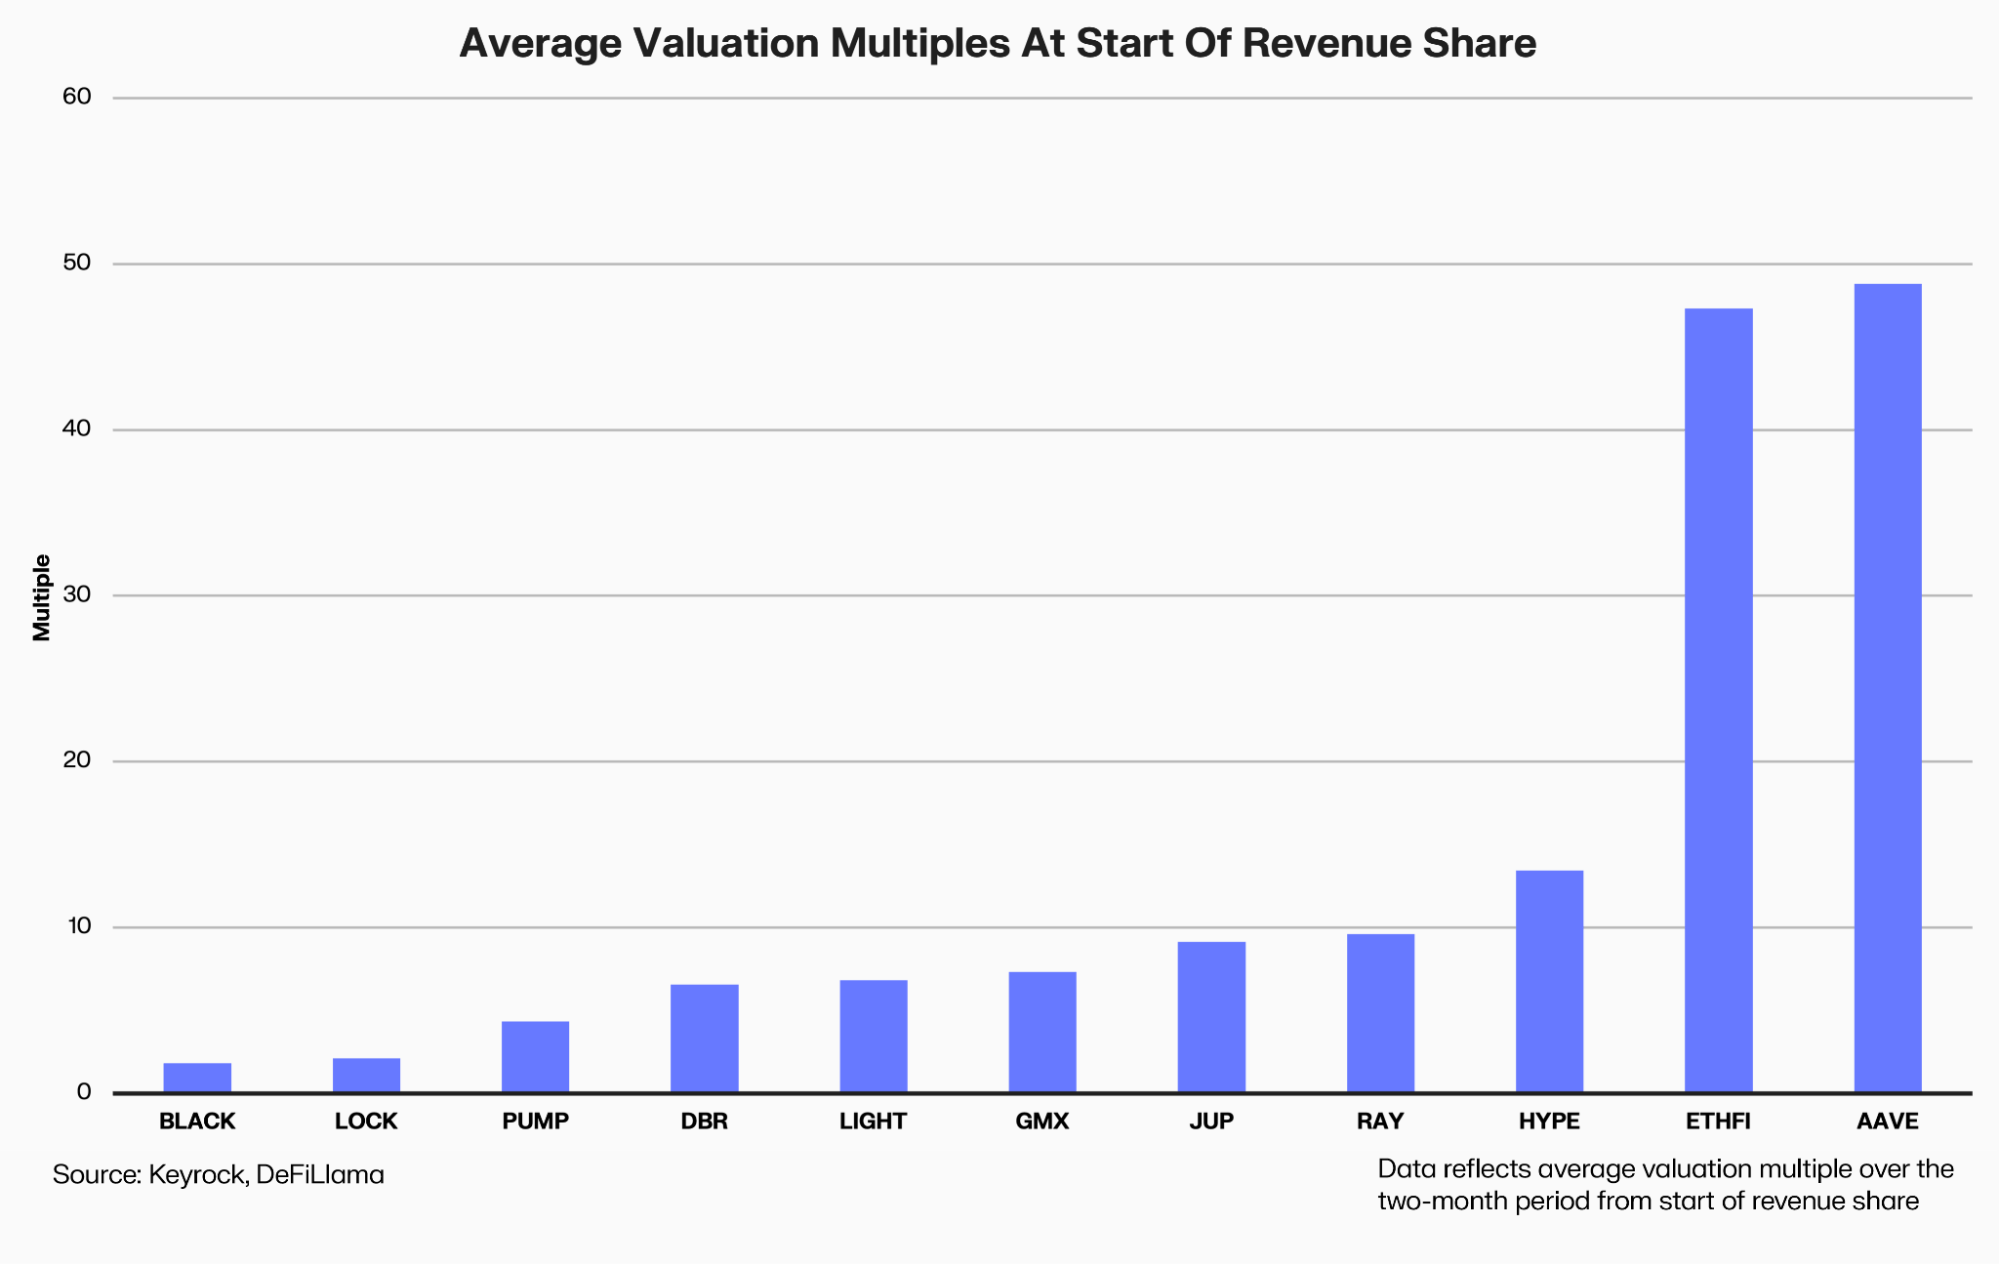
In practice, this makes the valuation multiple a checkpoint. A low multiple indicates buybacks can be impactful, but only if residual revenues and treasury balances still cover growth and reserves. Framed this way, the ratio becomes part of a broader decision set alongside revenue stability and runway.
Execution
Once a protocol commits to buybacks, the challenge is execution. Most strategies fall into three categories: programmatic, discretionary, and trigger-based. Programmatic models follow fixed rules that maximize predictability but often mistime market cycles. Discretionary models give teams flexibility, but reduce transparency. Trigger-based approaches sit in between, using predefined conditions to add counter-cyclical discipline while still leaving discretion in setting thresholds.
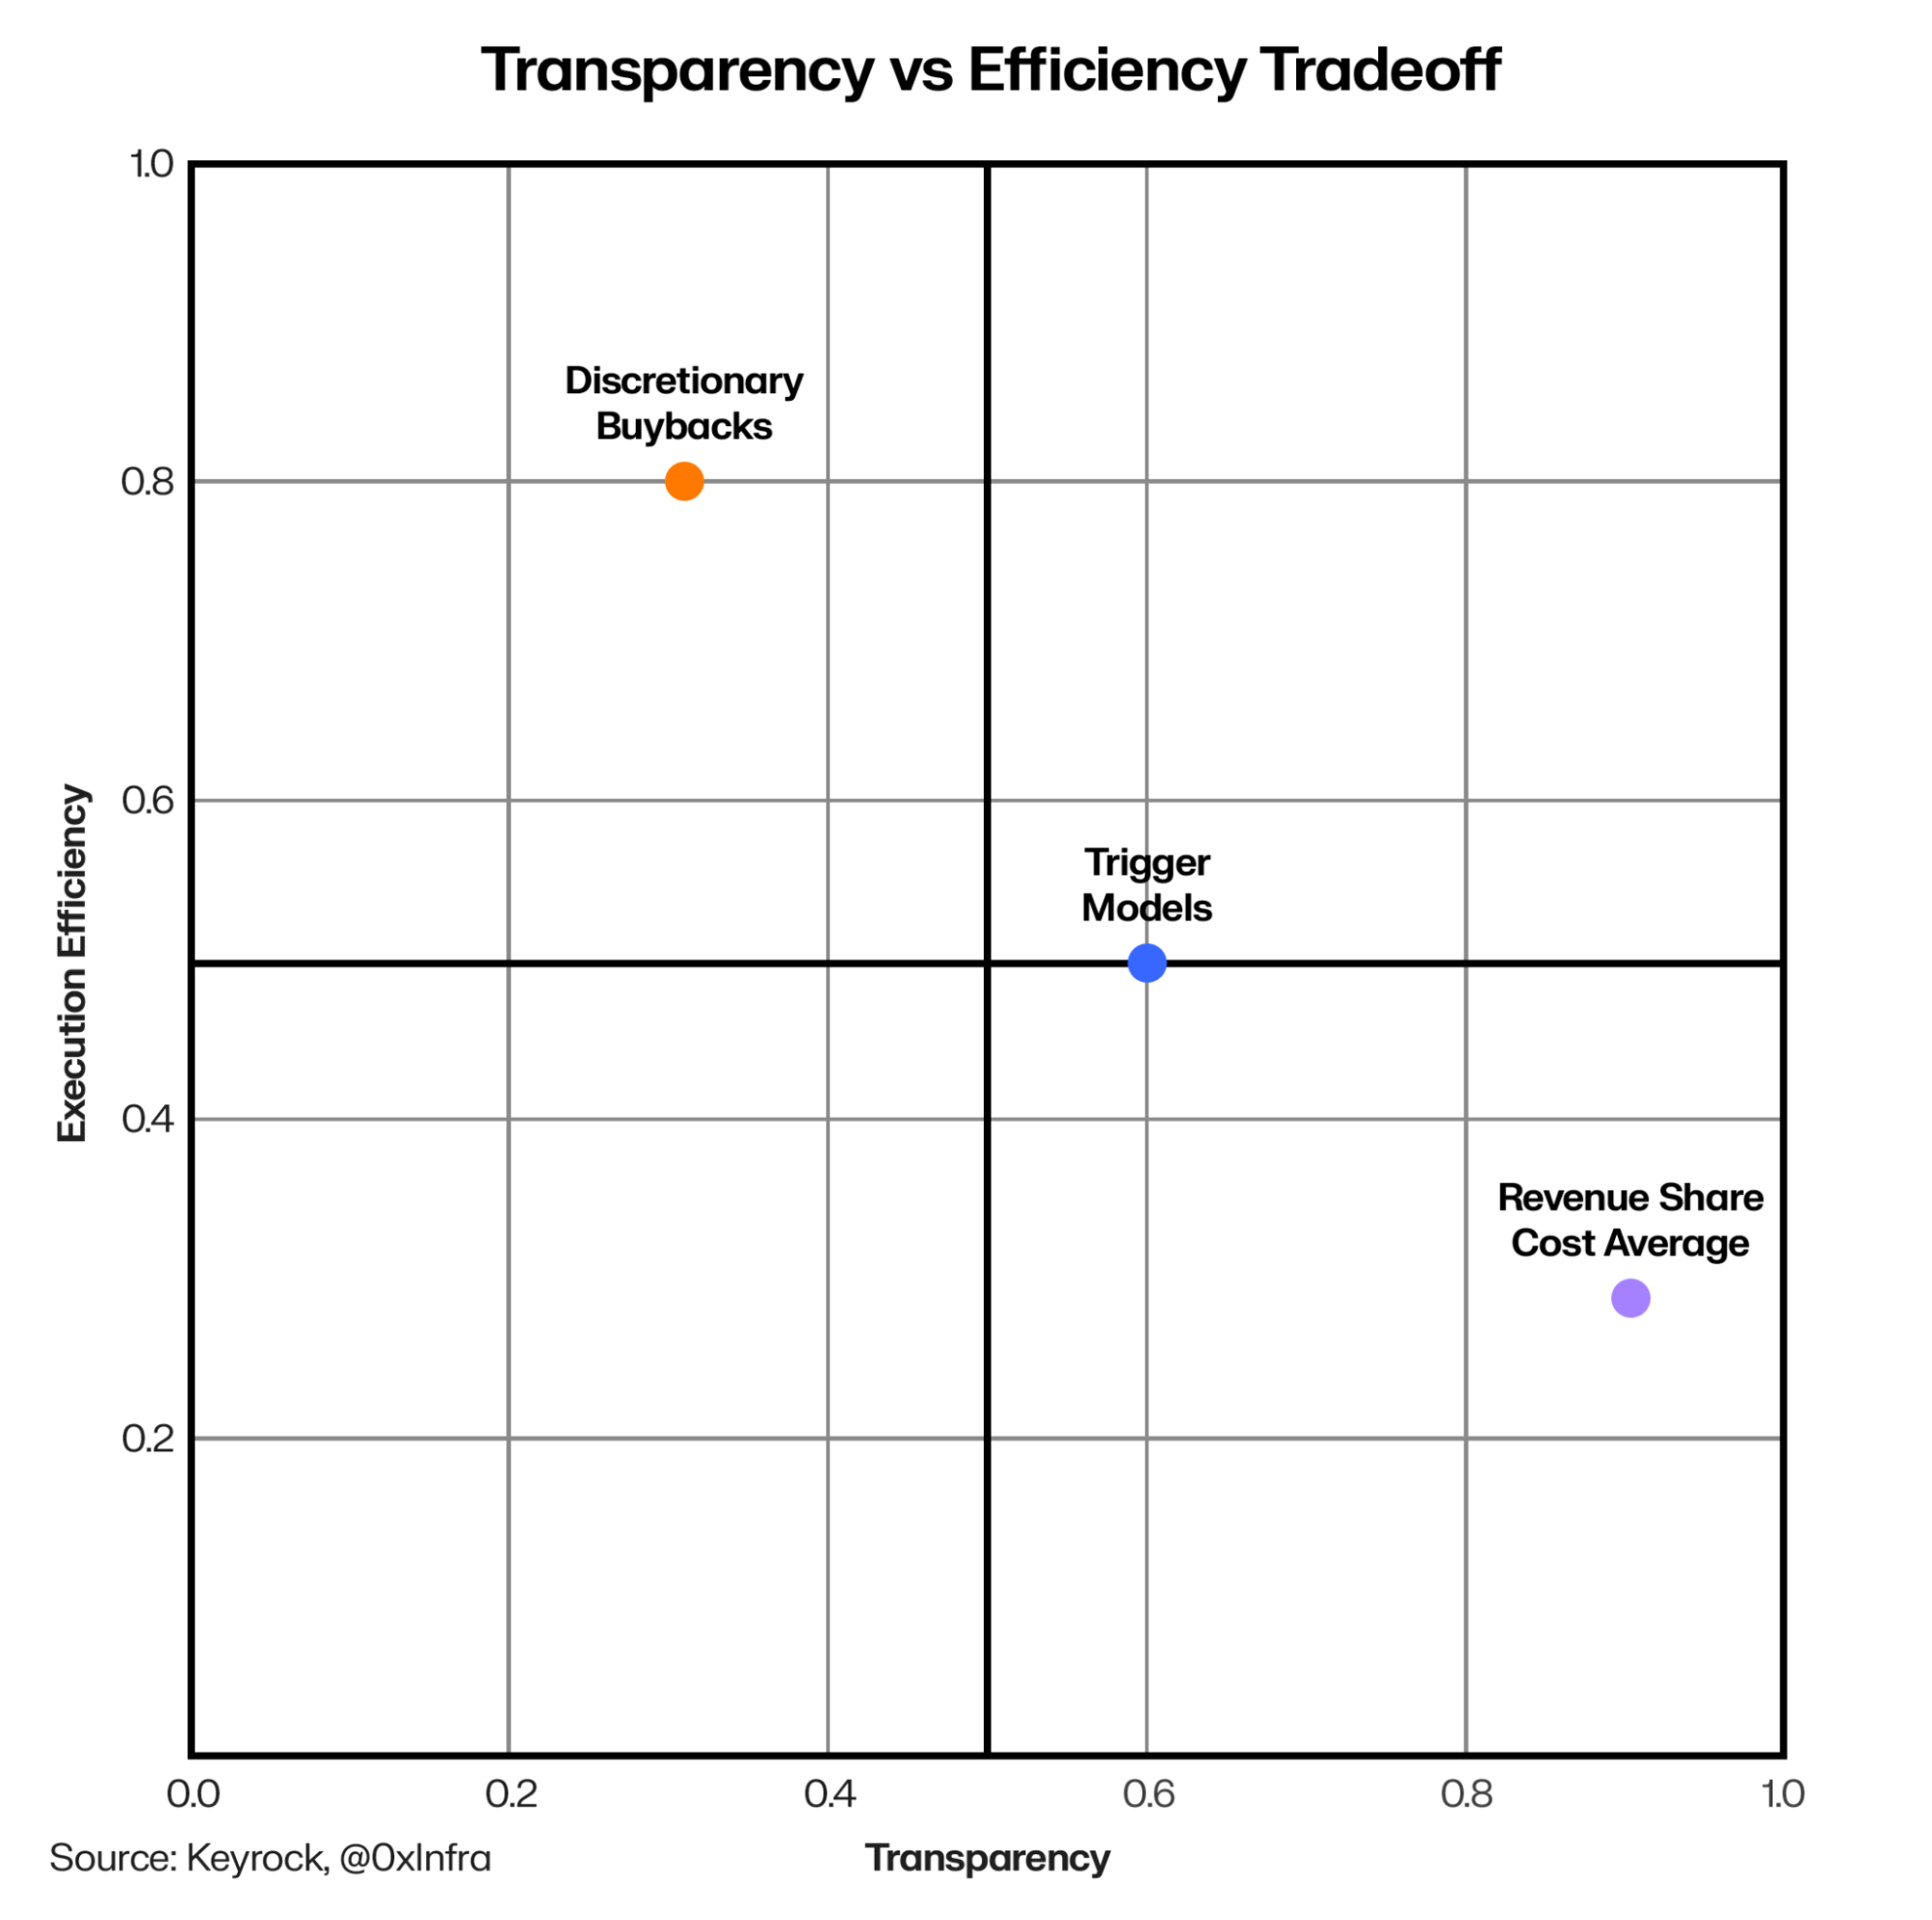
- Revenue Share Cost Average (Programmatic): automated repurchases where a fixed share of protocol revenue is continuously used to buy tokens from existing liquidity. It maximizes transparency and creates predictable value accrual, but the reflexive design often spends more during market peaks and less during downturns, leading to timing inefficiencies.
- Discretionary: the protocol (or its treasury managers) decides when, how much, and how to buyback tokens, rather than following a fixed, automatic rule. Unlike programmatic buybacks, discretionary buybacks give teams flexibility in execution and are efficient, but raise questions about information asymmetry that systematic models inherently avoid.
- Trigger: A hybrid of programmatic and discretionary models, where buybacks are activated once thresholds are met, such as token price falling below a 30-day moving average or valuation metrics like FDV or the P/S ratio entering predefined bands. This structure adds transparency while leaving discretion in setting triggers. It introduces counter-cyclical discipline by allocating more during downturns and less during peaks, but at the cost of greater complexity.
In this report, we’ll explore three trigger mechanisms that could provide the flexibility and efficiency of discretionary buyback mechanisms, while attempting to avoid the reflexive design of programmatic repurchases.
P/S Ratio, Trailing Revenue
The price-to-sales (P/S) ratio is a common valuation metric that compares a protocol’s market capitalisation to its trailing 12-month revenue. A lower P/S implies the market is valuing each dollar of revenue more cheaply, while a higher P/S suggests the token is priced at a premium relative to its fundamentals.
To test whether valuation influences buyback efficiency, we applied this framework to a protocol conducting buybacks. For each buyback day, we calculated the P/S ratio, then compared the cost basis of those buybacks to its price (avg. price in Sept. 2025). Buybacks at lower P/S ratios tended to preserve treasury value more effectively, whereas higher-ratio executions showed less impact.
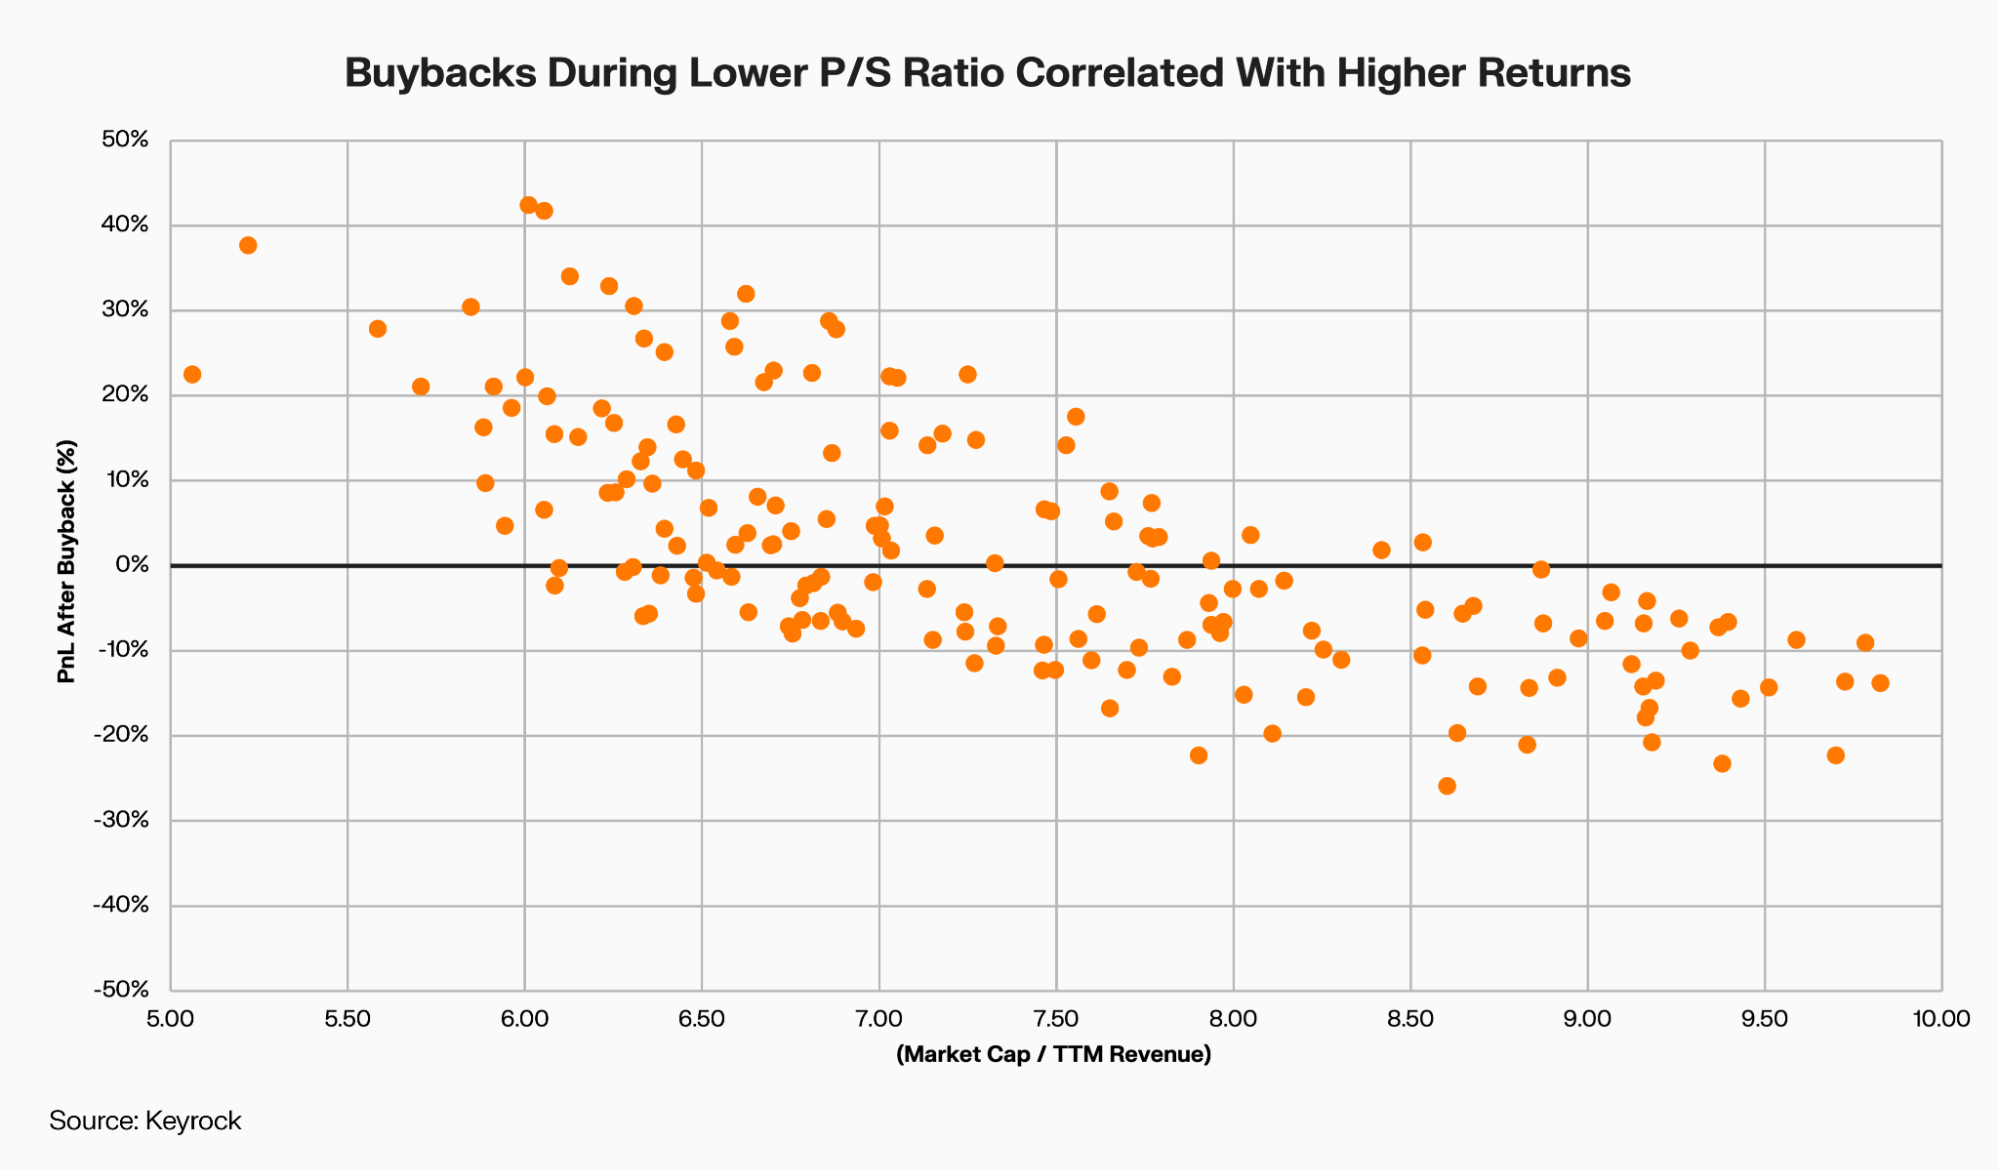
At first glance, it may seem like the P/S ratio is simply a proxy for price. However, across repurchase prices between $0.40 and $0.60, the token traded anywhere from 5.2× to 9.8× depending on the date.
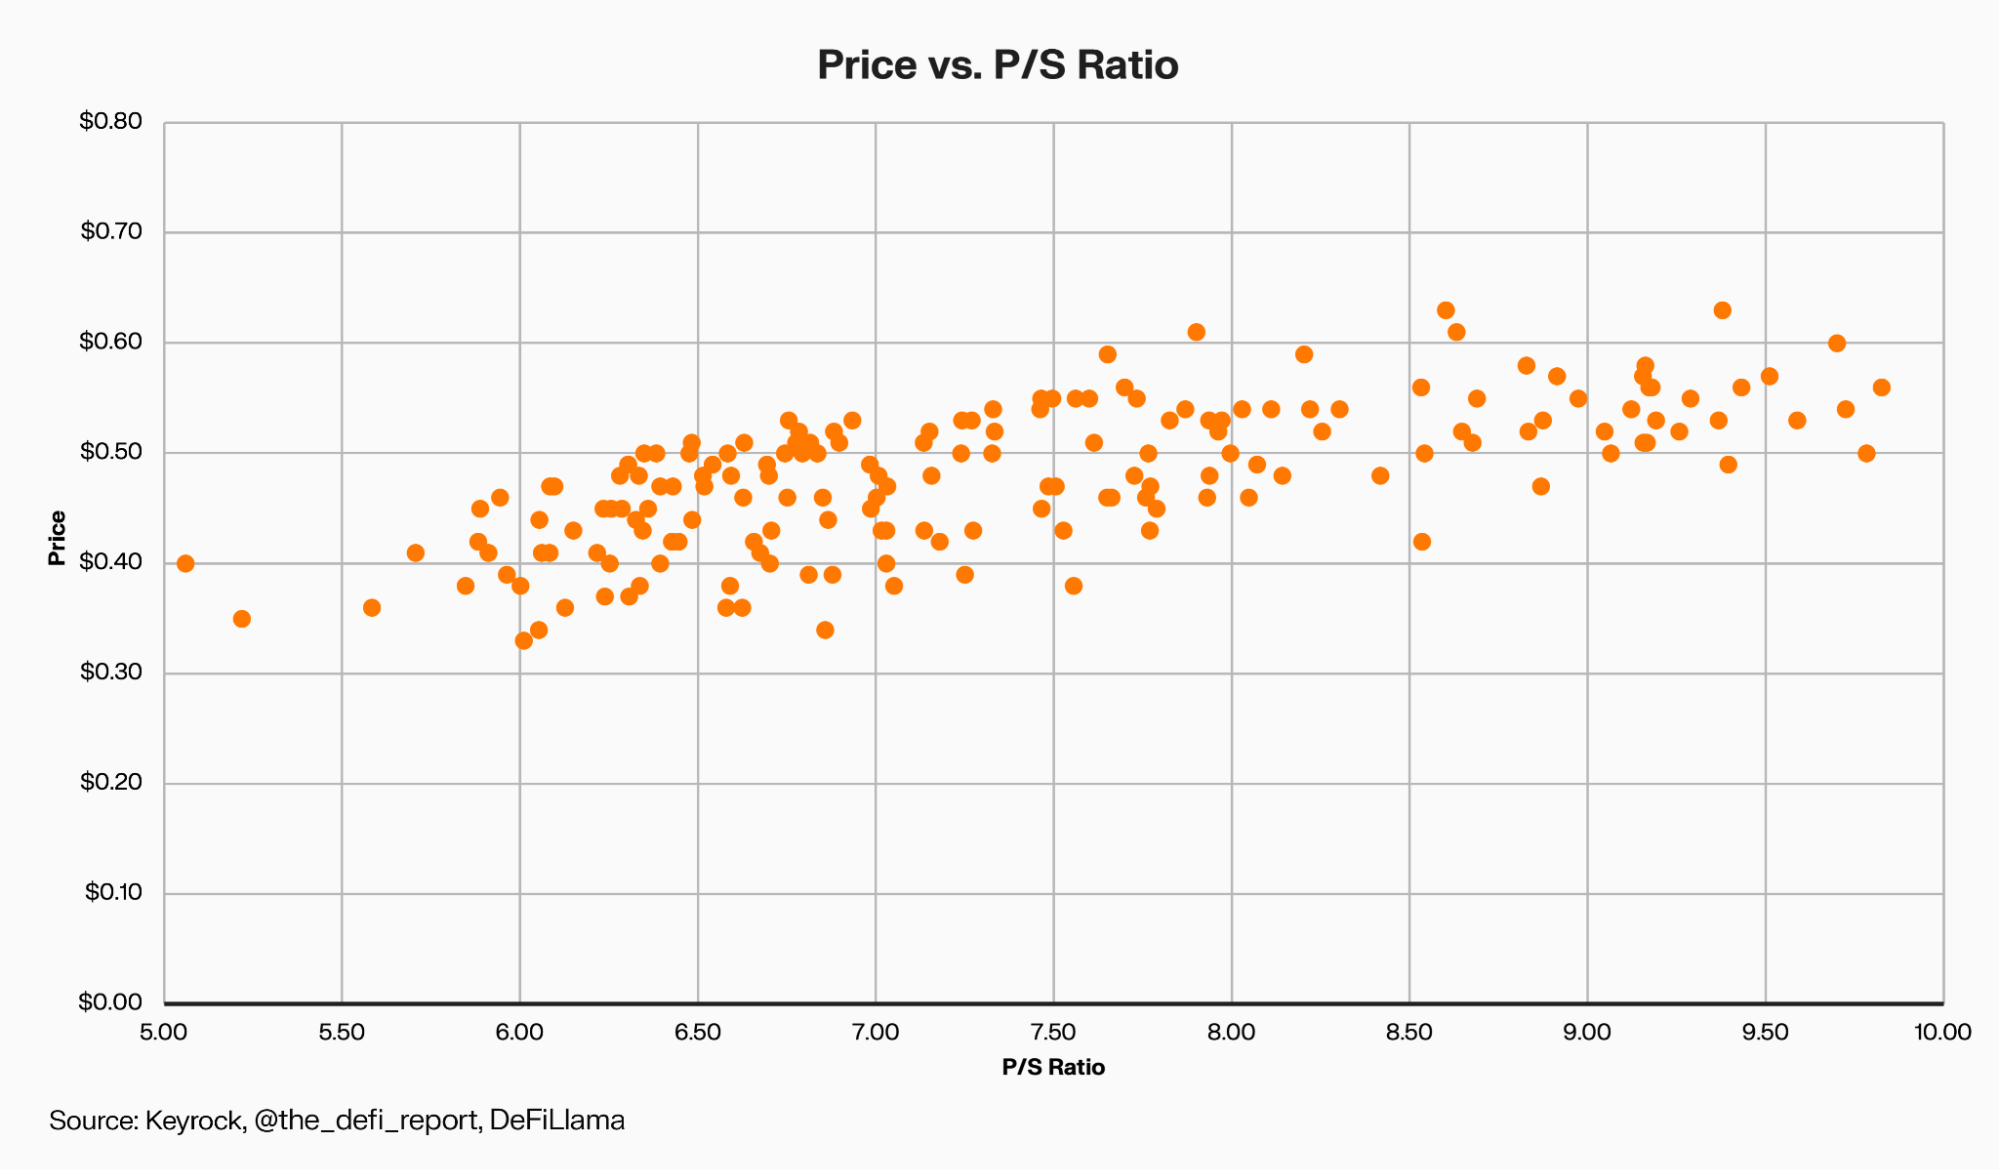
Buybacks at the same price can therefore reflect different valuations once revenue growth is accounted for. This suggests that valuation-sensitive execution could materially improve efficiency compared to purely programmatic models.
Dynamic FDV Buyback
In this model, the percentage of revenue allocated to buybacks scales with fully diluted value (FDV) according to the x * y = k curve. Taking Protocol A as an example, when FDV is at or below $1 billion, the full share of revenue earmarked for buybacks is directed toward repurchases. As FDV rises, the allocation declines along the curve:
-
- At $1.0b FDV → 100% of earmarked buyback allocation
- At $1.5b FDV → ~67%
- At $2.0b FDV → ~50%
- At $2.5b FDV → ~40%
This design ensures more aggressive buybacks when the token is deemed undervalued by the project team and more restraint when valuations are stretched. The $1 billion anchor (and subsequent bands) is ultimately a discretionary choice by the team, but once defined the framework enforces it systematically, ensuring discipline around those thresholds.
Applied retroactively, the simulated FDV band strategy would have resulted in $98.3 million spent on buybacks, accumulating ~40.2 million tokens at an average of $2.44. By contrast, the real program spent $184.6 million for ~57.3 million tokens at a higher average of $3.22. The difference is not only the lower purchase price, but also the $86.3 million in cash that would have remained in treasury reserves.

While FDV band buybacks can improve efficiency, they also carry signaling risk. Reduced repurchases at higher valuations may be seen as implicit price ceilings, while increased allocations at lower valuations can create perceived price floors. Still, anchoring execution to valuation bands helps avoid overpaying at peaks while reinforcing support during troughs.
Simple Moving Average Bands
This model ties buybacks to the token’s 30-day Simple Moving Average Price (SMA). If the current price is below the 30D SMA, 100% of earmarked revenue is deployed into buybacks. If the price is above the 30D SMA, no buybacks occur.
The idea is that projects conducting buybacks will deploy reserves during periods of relative weakness while conserving cash during rallies. In theory, this creates counter-cyclical execution, buying when the token is under pressure and holding back when valuations are stretched.
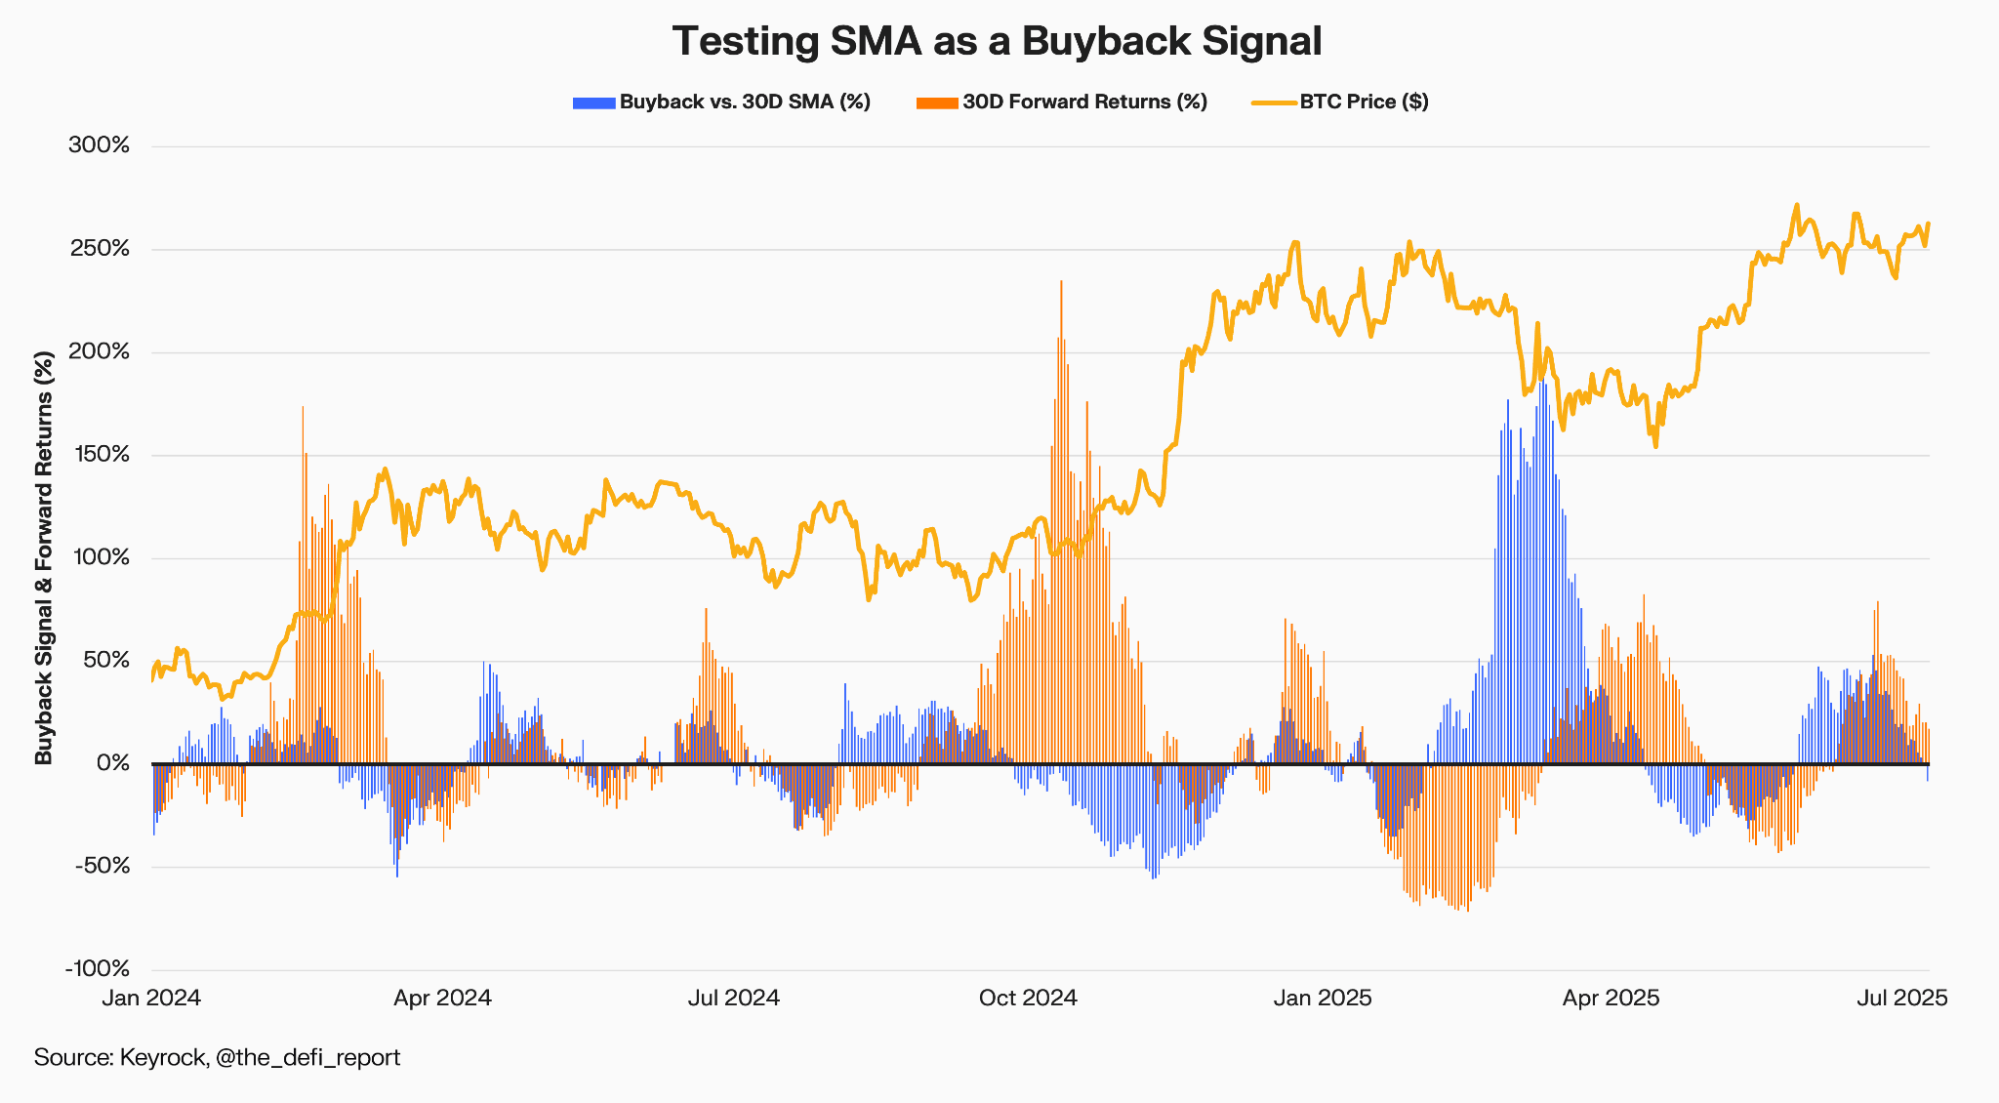
To test the model, we looked at Protocol B’s buyback days. For each buyback, we compared the execution price against the trailing 30D SMA (blue bars) and tracked the token’s performance 30 days later (red bars). If SMA were a reliable trigger, we would expect negative blue bars (buying below the SMA) to consistently align with positive red bars (forward gains).
In practice, no consistent correlation emerged. Out of 550 buyback days studied, SMA only predicted stronger forward returns 39% of the time. In many cases, buybacks below SMA, supposedly a signal of value, were followed by continued price weakness. Conversely, there were also instances where buybacks above SMA were followed by positive 30-day returns.
This suggests that while SMA provides a transparent and systematic rule set, it may lead to buybacks at relatively high valuations if the token has only recently dipped from a peak, and it might miss opportunities to buy during gradual uptrends.
Daily Buybacks Smoothed Over 30 Days
While trigger models help decide when to buy, they do not address the pacing of how those buys are deployed. To tackle this, we looked at smoothing mechanisms that spread a single day’s buyback evenly across 30 days, as well as approaches that take weekly purchases and distribute them over daily increments in order to reduce lumpiness and dampen reflexivity.
A potential way to strengthen the value of revenue distributions is through temporal smoothing. Instead of pushing buybacks into the market as soon as fees are generated, projects can spread the same notional spend over a fixed horizon. To illustrate this, we constructed a chart that overlays raw buyback activity with a smoothed version that distributes each day’s spend evenly across a month.
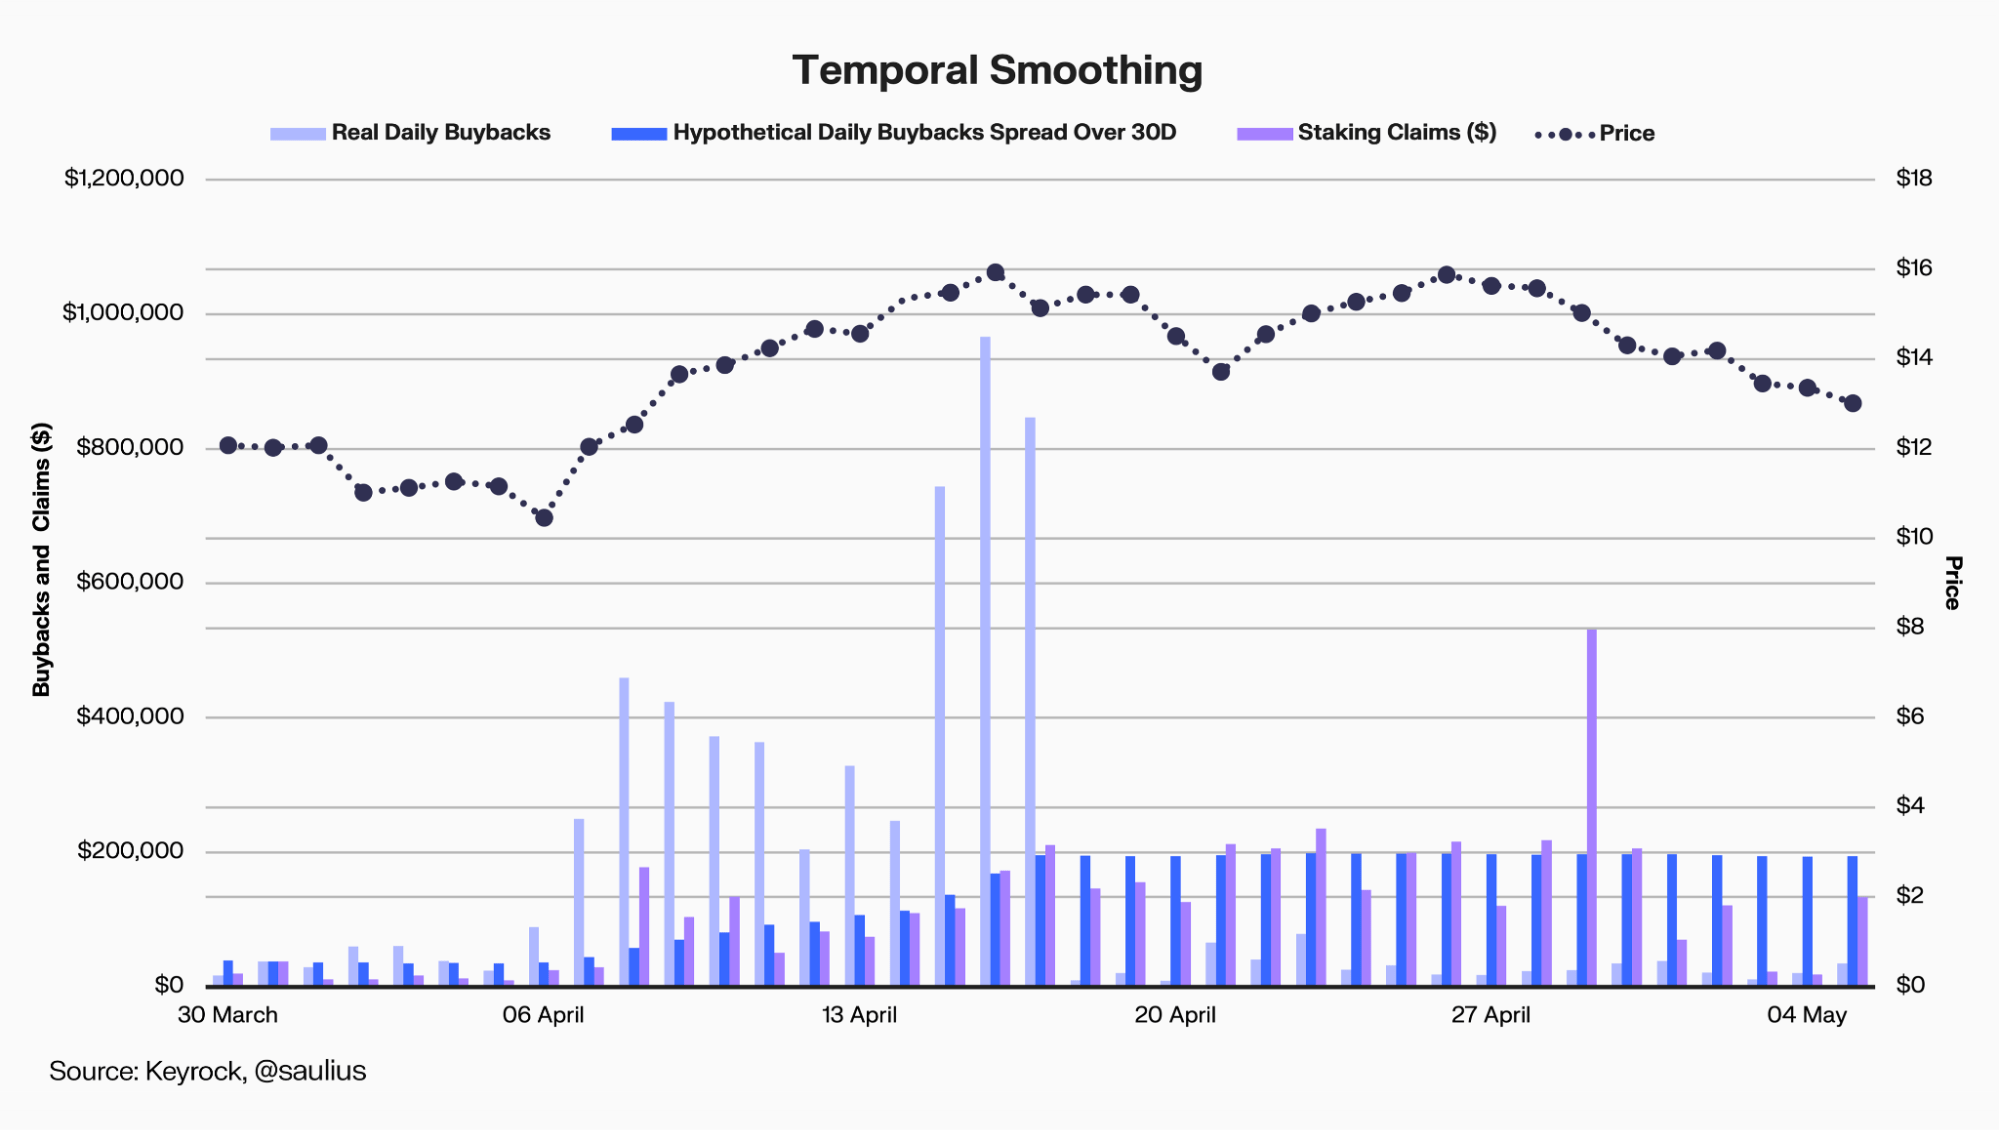
The raw buybacks (blue) are lumpy and volatile, reflecting the spiky nature of fee-driven repurchases. The smoothed series (red) shows how the same notional spend could be deployed in a steadier, more predictable manner when spread over 30D. We also included the protocol’s staking claims (yellow).
In practice, real buybacks often slowed after large revenue peaks, while smoothing would have stayed closer to staking claims, giving the project team a value stream that aligned more directly with realised rewards, while offering stakers a steadier yield.
Taken together, the chart shows how smoothing removes short-lived spikes, dampens reflexivity, and produces a more reliable baseline for assessing protocol performance. In practice this creates consistent buy-side support that is easier for investors to model, more comparable across protocols, and ultimately more credible.
Weekly Buybacks Smoothed Daily
In theory, one might expect that during a downtrend, spacing buybacks into larger weekly tranches would be more efficient. Each week, tokens could be purchased at progressively lower prices, compounding the benefit of the decline. Yet in practice, smoothing the same spend across daily increments can still prove advantageous. By avoiding the lumpiness of single large purchases, daily allocation reduces timing risk and delivers a steadier flow of buy-side support into the market.

Over the period studied, smoothing buybacks daily allowed the protocol to accumulate ~8% more tokens than it would have through weekly lump-sum purchases. Those additional tokens could flow to staked holders, while the steadier distribution creates a more predictable stream of value rather than volatile bursts. Even in a declining market, daily smoothing delivered both cost efficiency and a more consistent yield for stakeholders.
Case Studies
Outside of projects implementing buybacks through trigger models that account for financials, valuation, and smoothing, a project can utilise complementary execution strategies that can extend these principles into practical applications. Two approaches that projects can deploy are:
Options-based Covered Puts
A structure that lets projects buyback their token at predefined levels of their choosing, while earning premium income upfront. This approach provides flexibility in timing, spreads purchases across different price ranges to smooth entry, and generates revenue even if the token price never reaches those predefined levels.
In practice, the project team would allocate a fixed amount of stablecoins (for example, $1 million) and define several price levels where they would be comfortable buying back their token, say $100, $90, and $80. Each level represents a separate tranche within the overall structure, with a portion of capital allocated to each so that the team effectively averages into their buys. For every tranche, the project earns a premium.
If, by the option’s expiry date, the market price stays above the predefined levels (out-of-the-money, or OTM) of $100, $90, and $80, the tranche expires unused, the loan of $1m would be returned to the project team, yet the team would still retain the option’s premium. In this example, the team earns $49,500 in premium revenue at inception, regardless of how the token trades.

If the price falls below the predefined strike prices (in-the-money, or ITM), the project team retains the premium earned and proceeds to buyback tokens at those strike levels. This is essentially crucial as earning upfront revenue can partially offset potential downside if the market continues lower.
When structured across multiple levels, this laddered approach allows projects to scale into buybacks gradually as prices fall, rather than committing all capital at once. It smooths entry, generates upfront revenue to the project regardless of token price action, and creates a more disciplined, treasury-like mechanism for accumulating tokens over time.
Beyond structure, effective execution depends on understanding market liquidity, specifically, how much of it is organic versus artificial.
Organic Volume
A critical consideration in buyback execution is understanding the difference between total and organic trading volume, the share of activity driven by genuine market participants rather than short-term or artificial flows.
Calibrating buybacks to organic volume helps ensure that buybacks blend into natural market activity rather than distorting it. Executing during periods of healthy, organic liquidity allows teams to optimise average execution prices, reduce fees, and maintain orderly market conditions. It also minimises the risk of disrupting the token’s market structure or influencing other participants
Many project-led buybacks rely on taker orders that remove liquidity from the market, which can amplify volatility, especially for assets with thinner order books. As available bids are consumed, prices can rise during execution and become more fragile once the buying stops. In contrast, using maker orders calibrated to organic volume allows teams to add liquidity rather than remove it. By acting as a maker, the project benefits from the implicit bid offer spread rather than paying away to it.

For example, in a market with $10 million in reported daily volume, analysis may reveal that only $2 million reflected genuine, organic trading activity. Calibrating buybacks to 5% of organic volume (or 1% of total volume) in such conditions allows repurchases to be absorbed smoothly without visible price impact
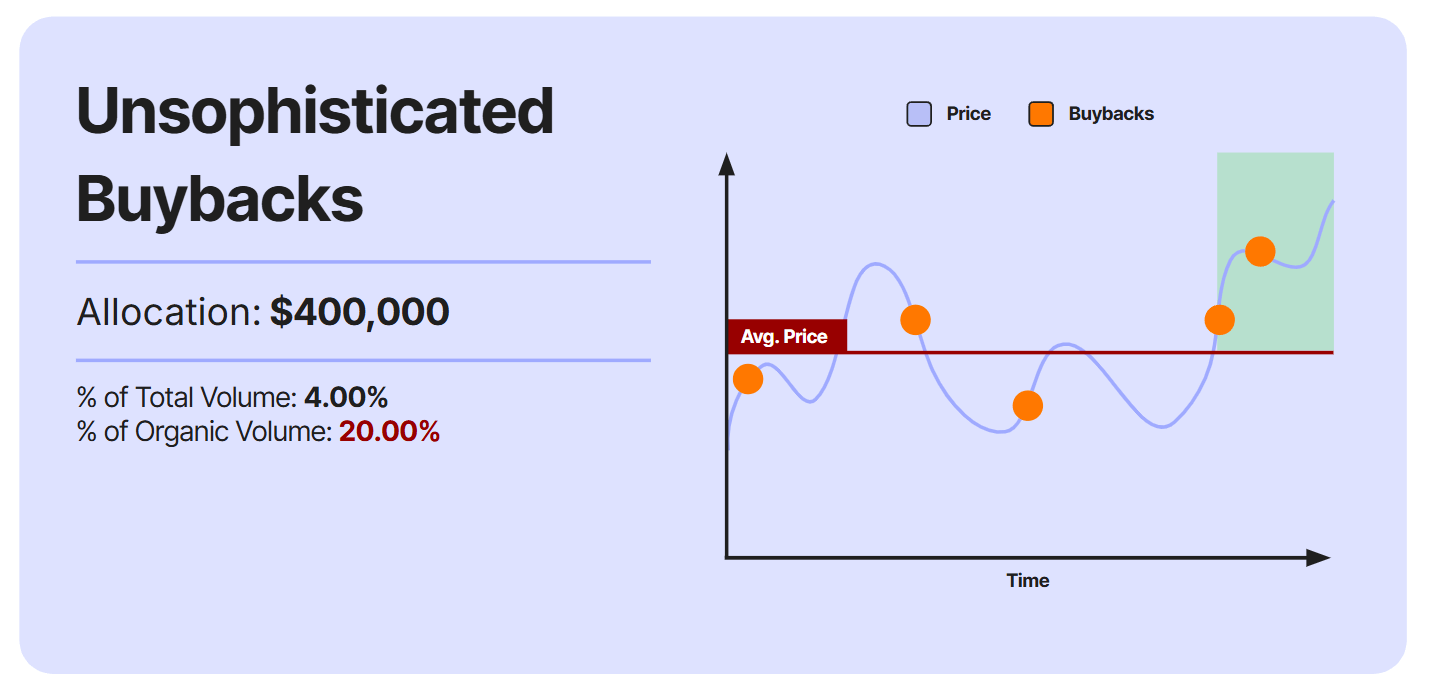
Unsophisticated buybacks often overlook this distinction. In the same example, a $400,000 allocation equivalent to 4% of total volume but 20% of organic volume, creates disproportionate pressure on the order book. Rather than blending into natural flow, such buybacks consume liquidity and can leave markets vulnerable to sharper reversals once the buying ends.
Understanding how much of an exchange’s activity is truly organic is crucial for gauging real market demand. Taken together, these approaches reflect a more mature view of buybacks, as structured, data-driven mechanisms for buybacks.
Conclusion
The core question is not only how buybacks are executed, but when they should occur. Timing matters as much as design. Premature repurchases can drain capital needed for product, growth, and runway, while disciplined programs, grounded in revenue stability, treasury strength, and valuation awareness, can reinforce alignment and credibility.
Our analysis shows that protocols tend to launch buybacks at different stages of maturity. Established projects often use them as a signal of financial strength and long-term alignment, while younger ones employ them as incentives to attract users and liquidity. Valuation metrics can serve as useful checkpoints, helping teams gauge when buybacks are most likely to be effective relative to fundamentals.
Once timing is established, execution determines impact. Programmatic models maximize transparency but often mistime cycles; discretionary models add flexibility but reduce predictability; and trigger-based frameworks aim to balance the two. In our tests, valuation-aware triggers improved efficiency, FDV bands helped conserve cash, and SMA thresholds proved too blunt to deliver consistent results.
Even with the right triggers, pacing remains critical. Smoothing mechanisms, whether spreading a day’s spend across a month or distributing weekly tranches into daily flows, reduced volatility, dampened reflexivity, and provided a steadier stream of value. Together, timing discipline, valuation-aware triggers, and smoothing tools offer a path to more credible, efficient buyback programs that align protocol performance with tokenholder value.
Covered Puts and execution strategies anchored in organic volume show how buybacks are evolving into structured, treasury-style mechanisms. The former allows teams to accumulate tokens strategically while earning revenue and the latter demonstrates how execution aligned with organic market activity can help dampen volatility.
As the space matures, the open question is which approach becomes standard: will protocols favor the transparency of programmatic models despite their inefficiencies, or adopt frameworks that blend discretion, valuation sensitivity, and pacing as the benchmark for sustainable tokenholder alignment?
If your team is considering or optimizing a buyback program, contact us to learn how Keyrock supports projects in building sustainable, data-driven strategies.
Disclaimer: The information in this report is for educational purposes only and does not constitute financial, investment, legal, or tax advice. Opinions are based on available data at the time of publication and may change. Keyrock does not guarantee the accuracy, completeness, or suitability of this information. Cryptocurrency investments are speculative and involve significant risks, including potential loss of principal. Consult a qualified advisor before making financial decisions. Keyrock assumes no liability for direct or indirect losses or damages arising from the use of this content.

Stay up to date
Get the latest industry insights, in-house research and Keyrock updates.
This site is protected by reCAPTCHA and the Google Privacy Policy and Terms of Service apply.