

6 April 2026
Key Insights: Deadline Drift
Stagflation Surfaces
Every Monday, we deliver a concise yet comprehensive briefing to help you navigate the week ahead.
Our weekly market dashboard brings together key insights across Macro, Crypto, and Onchain activity, distilled into a clear, actionable format. Whether you’re managing risk or spotting opportunity, start the week informed and aligned.
Join our Telegram Channel to get it delivered directly to your phone.
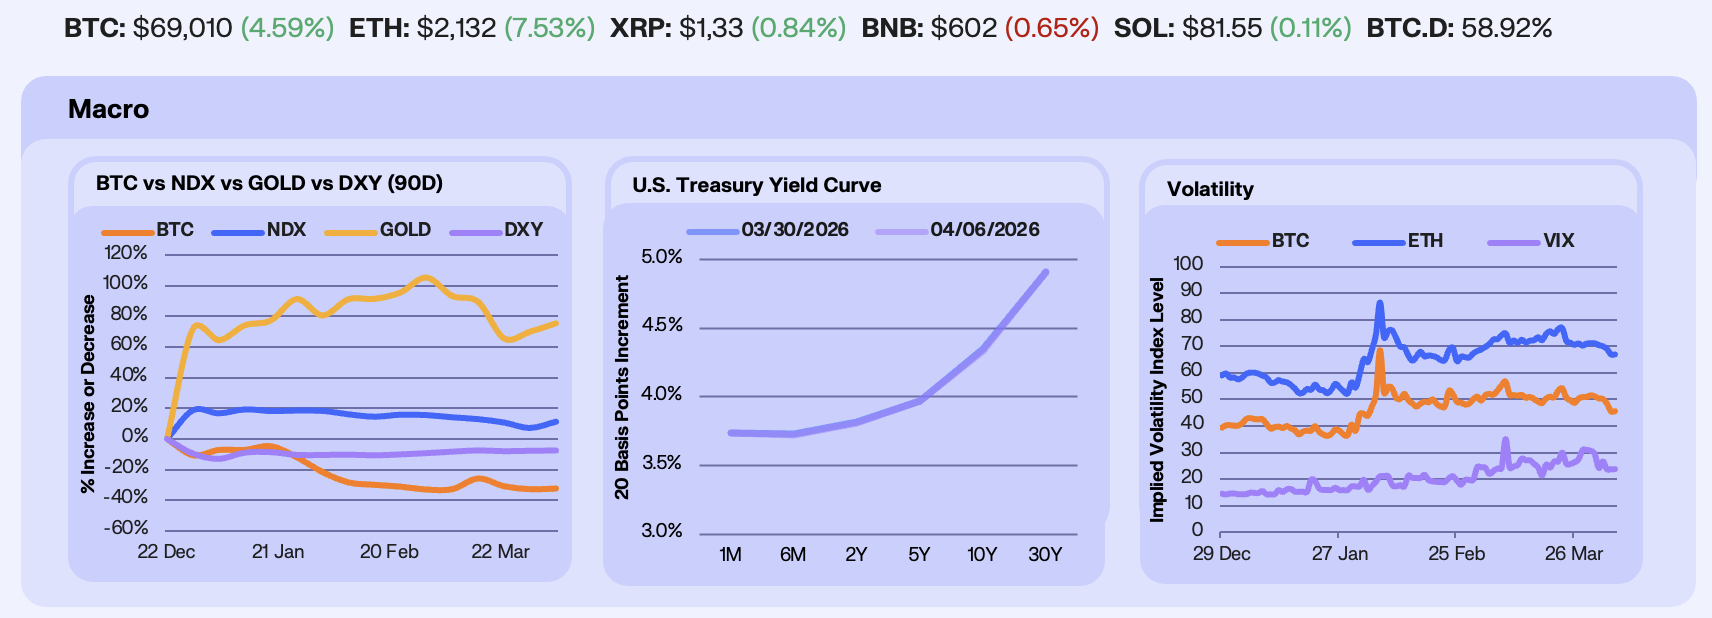
The ceasefire whipsaw that has defined 2026 repeated for a fourth consecutive week. The week’s strongest session came early, with the S&P 500 posting its best day since May after reports surfaced that Trump could end the war with Iran, pulling Brent below $102 and lifting equities across the board. Trump’s first national address on the war reversed the momentum as he vowed to “hit them extremely hard” over the next two to three weeks and offered no concrete exit plan, sending oil back above $109 overnight and dragging Asian markets sharply lower. NDX finished +4.0%, boosted by the early-week relief rally and SpaceX’s confidential filing for what would be the largest IPO in history at a $1.75 trillion valuation. Gold gained +3.8%, continuing its march toward all-time highs on sustained safe-haven demand. BTC added +4.6%, while DXY was flat.
Treasury yields paused after two straight weeks of grinding higher as the 30Y continues to flirt with the psychologically significant 5% level. Economic data was resilient but increasingly contradictory. ISM Manufacturing printed 52.7, its third consecutive expansion, while ISM Prices surged to 78.3, marking 18 straight months of rising input costs. ADP added +62,000 private jobs ahead of the +41,000 consensus, initial claims fell to 202,000, and JOLTS showed openings declining to 6.9 million from a revised 7.2 million. The 2Y sitting above the FFR upper bound keeps hike pricing alive, and the combination of strong hiring with surging input costs is the clearest stagflation signal in the data this year.
The VIX fell -22.5%, driven by quarter-end gamma unwinds, the removal of pin risk after last week’s $14B quarterly expiry, and early-week ceasefire relief that rapidly de-risked hedges elevated through Q1. Crypto volatility also compressed, with BTC 30-day ATM IV down -11.7% to 45.6 and ETH IV -5.8% to 67, though options positioning tells a more cautious story. BTC’s vol term structure remains inverted, meaning traders are paying more for near-term protection than for longer-dated hedges, a sign of elevated short-term anxiety. Downside puts are consistently priced above equivalent upside calls across every tenor for both BTC and ETH, with ETH’s front end showing the wider gap. Post-expiry, BTC options open interest sits at 388,000 BTC with a 0.69 put-call ratio, and the next major expiry anchor at April 24 holds 90,700 BTC. When falling vol and bearish positioning diverge like this, the resolution tends to be sharp.
Our Take: The macro setup heading into Q2 is increasingly stagflationary. Increasing raw material costs, contracting employment, and with Brent still above $100, the cost pressure is unlikely to fade soon. The Fed’s room to cut is narrowing with every strong payrolls print while the inflation data moves against them. That tension between a resilient labor market and accelerating input costs is what keeps the 2Y pinned above the FFR upper bound and leaves risk assets without the easing catalyst they need to sustainably re-rate higher. For BTC specifically, the options market is telling that traders expect the next move to be lower but orderly.
Exploit Rattles, Support Holds
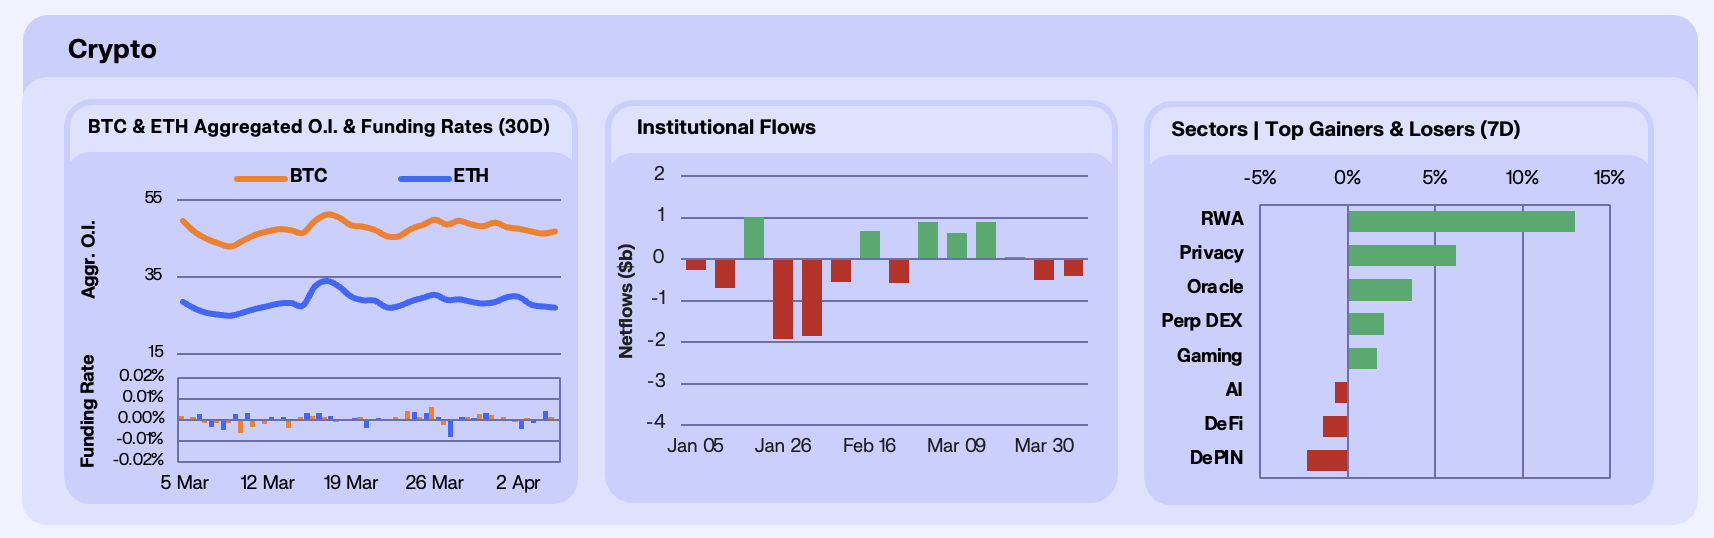
Derivatives positioning unwound through the week as geopolitical headlines whipsawed sentiment. BTC open interest fell -2.8% WoW to $46.9b, while ETH declined -3.77% to $27.1b. The bulk of the deleveraging occurred around April 2nd when Trump’s national address threatened to hit Iran “extremely hard”, which sent BTC briefly below $67k and triggered a wave of long liquidations. Funding rates oscillated around zero throughout the week, with BTC briefly turning negative on the 2nd and 4th before settling by Saturday, while ETH funding was more erratic. The pattern is consistent with a market that lacks directional conviction, where positions are built on headlines and unwound just as quickly, with neither bulls nor bears willing to hold through the noise. BTC and ETH both ended the week higher despite the OI decline, suggesting the net effect was a short squeeze on early-week Iran de-escalation hopes followed by cautious re-positioning rather than fresh leveraged longs.
Institutional flows turned negative again after March’s brief constructive window. Digital asset products recorded -$506m in outflows for the week, with ETH bearing the brunt at -$222m, followed by BTC at -$194m and SOL at -$12.3m. Ripple was the only product category with positive flows at +$15.8m. The ETH outflows are particularly notable given ETH’s spot outperformance, with the divergence signalling to our desk corporate treasury buying rather than ETF demand. This is confirmed by BitMine Immersion Technologies executing its largest weekly ETH purchase of 2026 (71k ETH, $143m), which more than offset the institutional redemptions in price terms. The broader trend remains one of incremental institutional de-risking, with cumulative outflows since November now exceeding $10b.
Sector performance reflected the week’s risk-off but catalyst-driven dynamics, with RWA tokens leading decisively at +13.0%, tracking the surge in underlying protocol AUM. Privacy (+6.2%) firmed as geopolitical uncertainty and surveillance concerns provided a thematic bid. On the downside, DePIN (-2.3%) extended its multi-week decline on continued unlock pressure, while DeFi (-1.4%) and AI (-0.7%) saw modest losses as capital favoured tangible catalysts over narrative exposure. SOL’s -2.9% underperformance was amplified by the Drift Protocol exploit on April 1st, a $285m loss via social engineering that marked the largest crypto exploit of 2026 and weighed on broader Solana ecosystem sentiment.
Our take: The market is stuck in a structurally cautious regime, holding support but unable to generate sustained momentum above resistance. BTC’s defence of $66-67k on both the geopolitical shock and the hot jobs print suggests a demand floor exists, likely anchored by the March ETF inflows providing a cost-basis level that institutional holders are reluctant to sell through. The April 7-9th macro calendar, with CPI in focus, is the next potential catalyst, where a softer print could provide the spark that geopolitics has failed to deliver.
Rates Reverse, Utility Leads
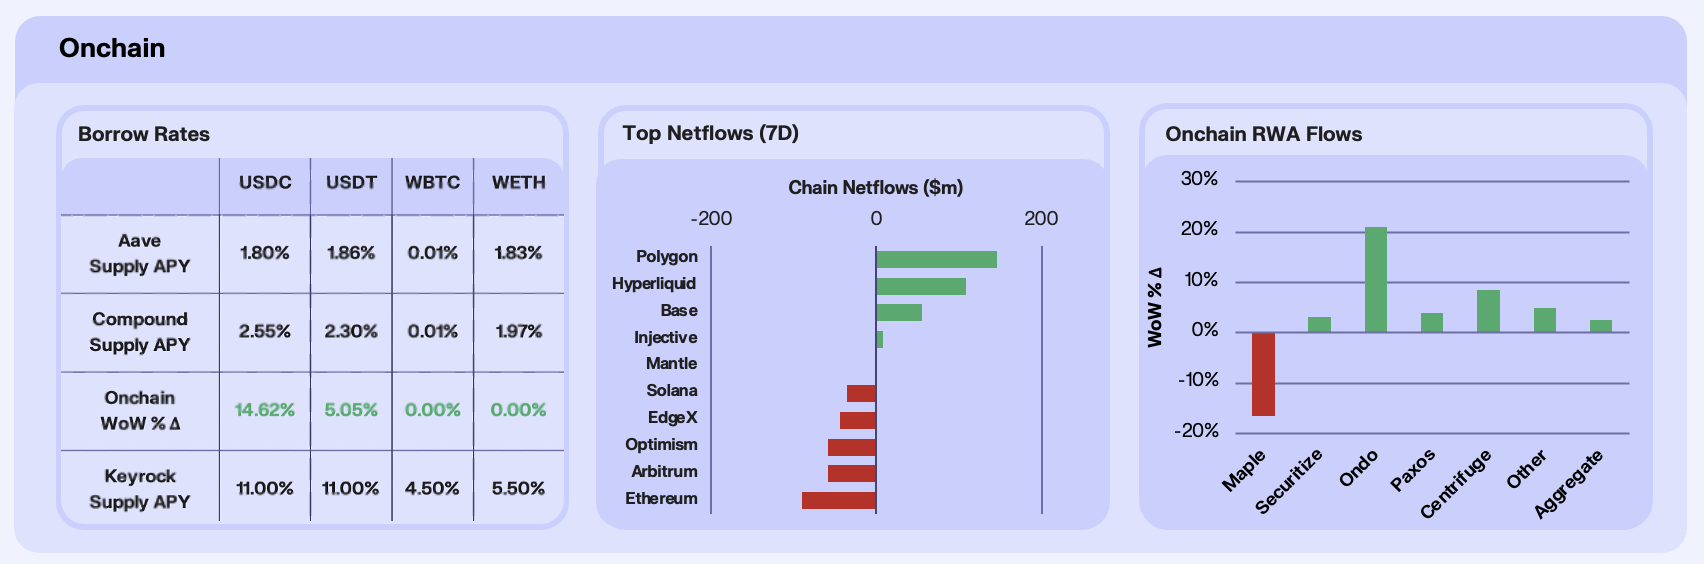
Onchain rates reversed several weeks of compression this week, with stablecoin yields firming for the first time since late February. USDC supply APY rose 14.6% WoW across major venues, while USDT rose more modestly, up 5.1% WoW. WETH supply APY held flat, suggesting that while dollar-denominated lending demand is returning, ETH-denominated leverage appetite remains subdued. Utilisation has not yet confirmed a sustained shift, and we remain cautious about reading too much into a single week of rate strength following prolonged compression.
Chain-level flows were strongly directional, with capital rotating decisively out of Ethereum. Polygon PoS led inflows (+$148.4m), driven by a surge in stablecoin payment activity. The chain recorded record-high stablecoin transaction volumes, capturing roughly 35% of global USD stablecoin transfer share as onchain stablecoin supply hit an ATH near $3.57b. Catalysts included Walmart-backed One Pay adding POL as a payment method, TokenPocket launching zero-gas USDC transfers, and Euclid Protocol going live connecting unified liquidity to Polygon’s 156m+ active addresses. Hyperliquid (+$108.5m) continued to absorb derivatives-driven capital as it hit $50b in weekly perp volume. Base (+$55.8m) attracted inflows on the back of Coinbase’s sharpened 2026 roadmap, signalling a deliberate push into tokenised markets and stablecoin scaling.
RWA AUM rose +2.62% WoW in aggregate, but the headline figure masked extreme dispersion driven by concentrated, event-specific catalysts. Ondo (+20.96%) was the standout, surging on its partnership with Franklin Templeton to tokenise five ETFs spanning equities, bonds, and gold. This was followed by immediate exchange listings on MEXC and BitMart that broadened distribution of tokenised stock pairs. Centrifuge (+8.48%) benefited from the launch of deSPXA on Base, the first tokenised S&P 500 Index Fund built under licence from S&P Dow Jones Indices. Maple (-16.51%) was the clear casualty, suffering meaningful redemptions from its syrupUSDC and syrupUSDT pools following the Drift Protocol exploit on Solana, which drained roughly $285m in assets.
Our take: This was the most structurally significant week for onchain markets in some time. The rate pickup in stablecoin lending, if sustained, would mark the first reversal of the compression trend that has defined Q1. We believe, however, that the nature of flows is more telling, particularly given Polygon’s stablecoins volume represents utility, as does Ondo’s 21% AUM surge. The signal we are watching is whether stablecoin rates hold above 2% into next week, if they do alongside sustained Polygon payment volumes, it would suggest the onchain economy is finding a floor built on utility rather than leverage.
The DEX Spot Drought
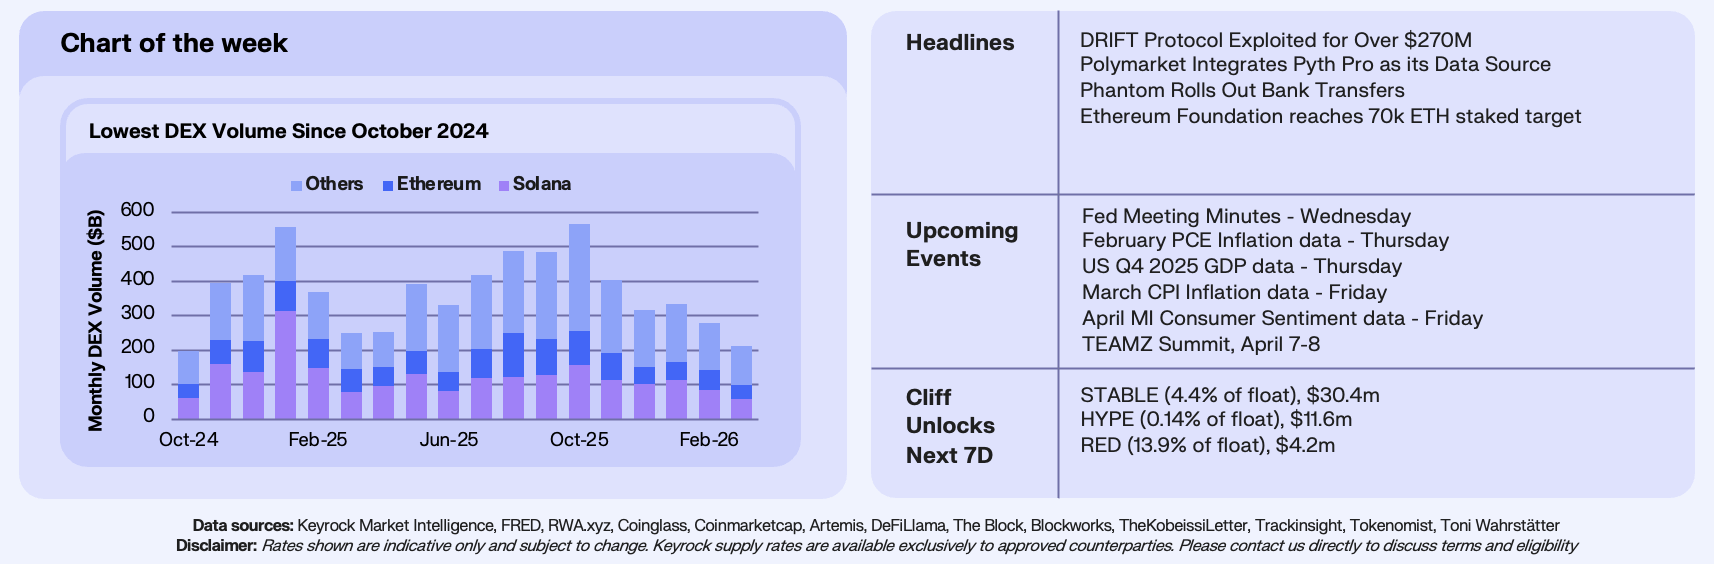
This week’s chart tracks monthly DEX volume across Ethereum, Solana, and all other EVM chains since October 2024. Total spot DEX volume hit $212 billion in March 2026, its lowest level since October 2024’s $199 billion. The entire volume expansion of the past 18 months has effectively been returned. At the October 2025 peak, monthly DEX volume reached $567 billion across all chains. Five months later, it has fallen 63%, with March marking the fifth consecutive month of declining activity.
The decline is broad-based. Solana fell from $156 billion at the October peak to $57 billion in March, a 63% drop. Ethereum printed $42 billion, its lowest monthly volume since October 2024. The “Other EVM” category, which includes Base, Arbitrum, BSC, and Hyperliquid, contracted 64% from $312 billion to $113 billion, giving back most of the L2 expansion that defined the summer and autumn of 2025.
Two distinct volume cycles are visible in the data. The first ran from October 2024 to January 2025, peaking at $557 billion as Solana memecoin activity drove the chain to 56% of total DEX volume in a single month. That pulled back to $251 billion by March 2025 before a second cycle built through the summer, this time led by L2 and alt-EVM expansion rather than Solana. The second peak in October 2025 ($567 billion) was marginally higher and structurally different, with volume distributed more evenly across chains. The current drawdown has now exceeded the first cycle’s 55% pullback and is still deepening.
Our Take: Spot DEX volume is a proxy for onchain conviction, and right now there is very little of it. BTC has been range-bound between $60,000 and $73,000 for five weeks, which removes the directional catalyst that drives most retail spot activity. The combination of war-driven macro uncertainty and compressed rate-cut expectations is keeping capital and speculation sidelined. A break below Ethereum’s October 2024 levels would mean the bull market’s entire onchain trading expansion has been fully unwound.
Join our Telegram Channel to get it delivered directly to your phone.

Stay up to date
Get the latest industry insights, in-house research and Keyrock updates.
This site is protected by reCAPTCHA and the Google Privacy Policy and Terms of Service apply.