

BTC Treasuries Uncovered: Premiums, Leverage, and the Sustainability of Proxy Exposure
Written by: Ben Harvey and Will Clemente III
Key Findings
- Bitcoin Treasury Companies have accumulated around 725k BTC, equivalent to 3.64% of the entire BTC supply.
- In 2025, Bitcoin Treasury Company impact on BTC price was limited, contributing to only 0.59% of daily BTC price impact on average. This was materially higher on days in which Strategy bought, reaching up to 9.05% of daily BTC price impact.
- Bitcoin Treasury Companies trade at, on aggregate, a 73% premium to the value of their underlying BTC holdings.
- Strategy’s Bitcoin per Share has grown ~11x since inception, delivering a CAGR of ~63.6%. We make the argument that this track record provides a strong basis for justifying the current NAV premium
- Bitcoin Treasury Companies have collectively raised ~$3.35 billion in preferred equity, and ~$9.48 billion in debt, as well as common equity issuances. This translates to a wall of maturities in 2027 and 2028, as well as frequent interest and dividend payments from present through 2031.
- Cash flow from underlying core businesses differs vastly across the Bitcoin Treasury Company cohort. Most, with debt payments and low to negative cash flow, are servicing interest and dividend payments with ATM issuance. If premium to NAV compresses, these companies could be the first to face challenges.
The Rise of the Bitcoin Treasury Company Vehicle
A growing group of publicly traded companies have begun leveraging Bitcoin as a strategic treasury asset, with the sole goal of providing investors with exposure to the asset. From crypto-native firms to listed multinationals, these Bitcoin Treasury Companies (BTC-TCs) are using a mix of debt, equity, and operating cash flows to accumulate BTC at scale.
As institutional interest continues to build, understanding the health of these companies is essential to anticipating how this segment may evolve. More importantly, understanding each company’s actual BTC exposure, and how sustainable their strategy is based on operating income and debt obligations, offers deeper insight into the landscape.
In this report we explore four dimensions of the BTC-TC phenomenon. First, we break down what these companies are and how they operate. Second, we evaluate their market impact, before moving on to the capital structures BTC-TCs employ to measure their BTC exposure efficiency. Finally, we assess their financial health and sustainability through debt servicing and runway metrics.
Bitcoin is increasingly viewed by institutions as a sovereign, finite, and censorship-resistant store of value, especially in an environment of persistent fiat debasement and rising geopolitical risk. Since 2020, the dominant driver of global asset markets has been monetary policy and global liquidity paired with a fiat currency fueled sovereign debt expansion. Liquidity can be thought of as the fuel of financial systems, created primarily through central bank balance sheet expansion, as well as a surge in private credit creation, shadow banking flows, and collateral velocity. The supply of fiat currency has surged while its integrity eroded, and to some.
In this environment, Bitcoin (BTC) has gained traction as a pure hedge against monetary debasement, offering a fixed supply alternative to fiat currencies subject to perpetual debasement led by the US’s Federal Reserve. This debasement is driven by the need to service high debt loads, both outright and relative to economic output. Far from a fringe asset, BTC represents a response to the capital mispricing and credit distortions caused by structurally loose global liquidity. In addition to this hard money demand, BTC’s liquidity, 24/7 markets, perception as a macro asset, and growing financialisation including a robust futures derivatives market, ETFs, and a developing financing market for holders, have made it increasingly viable for institutional allocation, both tactically and strategically.
The growth of BTC as an asset paired with the growing case for allocation has sparked a surge of interest from HNWIs, pension funds, and sovereign wealth funds around the globe. Amongst these new market entrants, one new market participant that has seen tremendous growth has been Bitcoin Treasury Companies (BTC-TCs). These companies are known for raising capital, often through debt, equity, or convertible instruments, with the goal of buying more Bitcoin and increasing their Bitcoin exposure per share. Some also use financial strategies like NAV arbitrage or shelf offerings, the ability to register stock issuances and sell them over time, to boost their BTC-per-share metrics without necessarily buying new BTC on the open market.
To date, BTC-TCs have acquired ~725k BTC, with a major uptick occurring in November 2024, taking BTC-TC from a mere ~330k BTC to where they sit today. This uptick was driven by Strategy copycat entrants as the narrative around BTC-TCs heated up, as well as continued accumulation by Strategy themselves, both of which have been driven by increasing institutional demand for BTC.

Strategy (previously Microstrategy), the pioneer led by Michael Saylor, leads the charge with ~597k BTC on its balance sheet. This accounts for ~82% of all BTC-TC holdings, dominating the remainder of BTC-TCs which range from mining companies such as Marathon Digital, through to closer Strategy copycats such as Twenty One Capital, Metaplanet and Semler Scientific.

For context, institutional investment funds seeking Bitcoin exposure in a compliant manner typically have three options: Bitcoin mining equities, spot BTC ETFs, or BTC-TCs. Until recently, mining firms were the go-to proxy. But, miners are still operational businesses that earn BTC, then often sell it to cover costs like energy and hardware. That dilutes their BTC exposure over time and makes them a less pure play. ETFs offer cleaner access, but many institutional mandates still prohibit direct crypto exposure, even via regulated funds. That leaves BTC-TCs, listed operating companies that simply hold BTC on their balance sheet, as the cleanest structural workaround.
And it’s catching on. BTC-TC holdings outweigh those of miners significantly. Please note that Marathon Digital, a Bitcoin miner, is considered a BTC-TC in this report, following two acquisitions of BTC outside of normal operation to be held on its balance sheet. In addition to this, BTC-TCs are equivalent to ~54.99% of US Spot ETF holdings.

So how exactly has Strategy adopted a BTC treasury strategy and become one of the best performing equities on the planet?
Understanding Strategy, The Pioneer
In the summer of 2020, MicroStrategy co-founder Michael Saylor emerged as the first public company CEO to champion BTC as a primary treasury asset. Alarmed by accelerating monetary debasement, Saylor led MicroStrategy to pivot aggressively, not just hedging in BTC, but going all in. His decision would mark the birth of the Bitcoin Treasury Company movement.
Below, we will break down MSTR’s various financing levers, compare its approach to other BTC-TC competitors that have emerged, and most importantly, assess their market impact and sustainability going forward.
MSTR first announced that it had purchased ~21k BTC for $250 million in August 2020. In September 2020 they doubled down, purchasing an additional ~17k BTC for $175 million, By the end of 2020, the company owned ~70k BTC at an average purchase price of ~$16k, making its total BTC position worth just over $1.1 billion.
March 2021 was a pivotal moment for the company and its BTC strategy, marking the first issuance of convertible debt notes, enabling them to deploy $1.05 billion to acquire an additional 9k BTC. What exactly are convertible notes and how do they work?
Convertible notes refer to a financial instrument that allows investors to get exposure to a company in a way that limits downside. Convertibles notes, or converts, are a debt offering that instead of simply getting paid back in cash, allows investors the option to convert the debt, sometimes in addition to interest, into equity. This can occur either after a preset conversion price is reached or at a pre-determined discount to its current valuation, with MSTR utilising the former. For investors seeking BTC exposure, the convertible note offers downside protection not available to outright MSTR shareholders, though this comes at the cost of capped upside if MSTR doesn’t hit the conversion price. This makes these note issuances an asymmetric way to get exposure to BTC, especially for pension funds, sovereign wealth funds, endowments, or other investment vehicles that have a mandate against investing in BTC but are able to invest in a debt structuring like a convertible note.
In March 2021, MSTR issued its first convertible debt issuance. These were $900 million of 0% coupon senior convertible notes due 2027 with a conversion premium of 130%. In this debt offering, MSTR has the ability to effectively force conversion on the notes between February 2025 and the maturity date of February 2027, or if MSTR traded above the agreed upon conversion price for a pre-determined period of time. The market expressed its appetite for the company’s debt offering early on, with the initial issuance being oversubscribed by $150 million.
Today, MSTR has issued around $7.3 billion in convertible debt. But that’s only part of the story, Saylor has also tapped into the equity markets through a series of stock offerings to acquire additional BTC. Let’s dive in below.
ATM Common Stock Offerings
At The Money (ATM) stock offerings, refer to the process in which a company is able to create new shares and sell them onto the open market. ATM issuances can vary based on the type of stock issued.
The easiest ATM offering to understand is common stock ATM issuances. This is when common stock is created and sold directly onto the open market. While simple, this type of offering has been incredibly effective, with Strategy having issued ~$10 billion of common stock ATM, with a new $21 billion program launched in May of this year. These offerings are particularly powerful because Strategy typically trades at a premium to its Net Asset Value (NAV) of its BTC holdings. When that premium widens, the company can issue new shares at elevated prices, use the proceeds to buy more BTC, and, as long as the BTC acquired outweighs the dilution from new shares, increase BTC held per share. In effect, it’s a way to convert market sentiment into hard Bitcoin exposure.
ATM Preferred Stock Offerings
Strategy also issues preferred stock through ATM offerings. Preferred stock sits higher in the capital structure than common stock, meaning it has priority in the event of liquidation. MSTR’s capital stack, from most to least senior, i.e. who gets paid out first in the event of liquidation, goes: Senior Secured Debt, Senior Unsecured Debt, Subordinated Debt, Preferred Stock, and finally, Common Stock. In addition to its seniority, preferred stock typically comes with a fixed recurring dividend, similar to a bond’s interest payment, and takes precedence over common stock issuance. Strategy has executed three nuanced preferred equity rounds, which are detailed below.

STRK
The first preferred offering that Strategy structured is STRK, which was announced in January 2025 and established its ATM program on March 10th. This convertible preferred stock offers an 8% dividend to investors. The convertible component means that STRK holders are able to convert STRK shares to Class A Common Stock under certain conditions, with a 1:10 conversion ratio and an effective conversion price of $1,000 per share for common stock. STRK also has cumulative dividends which means that missed payments accumulate and will be given priority over common stock holders to receive their dividends.
The initial offering for STRK was originally $500 million and was upsized to $750 million due to strong demand. The current market capitalisation of STRK as of June 6th is $1.12 billion.
STRF
STRF, whose ATM program was launched on May 22nd, has a 10% dividend and similar seniority to STRK, including the integration of cumulative dividends.
The initial offering for STRF was $500 million and was upsized to $723 million. The current market capitalization as of June 6th is $930 million.
STRD
The newest of the three, the IPO of STRD was announced on June 2nd and started trading on June 9th. STRD is not as senior as STRK nor STRF, with dividends on STRD not being cumulative. Strategy has the right to redeem all STRD stock for cash proceeds if the amount of STRD stock outstanding becomes less than 25% of the initial offering and any future offerings combined.
The initial offering for STRD was $250 million and was recently upsized dramatically to $1 billion. As of July 7th, Strategy further expanded its capital raise ambitions by launching a $4.2 billion ATM equity issuance program for STRD, indicating continued investor demand and strategic use of STRD as a capital formation vehicle.

The Strategy Challengers
With the success of Strategy, we have seen various competitors emerge that are replicating their approach, a trend that is unlikely to lose momentum given the further success of copy cats in recent months.
Marathon Digital
As the largest publicly traded Bitcoin miner by hash rate, Marathon Digital Holdings (MARA) has been a key player within the Bitcoin ecosystem for years. In addition to trying to capture value from the rapidly growing asset class of Bitcoin through mining operations, MARA began holding Bitcoin on its balance sheet in late 2020 that was acquired through mining operations. The firm also made its first cash Bitcoin purchase of 4,812 BTC for $150 million in January 2021 as a reflection of its bullish outlook on the digital asset. However, with the mining business becoming increasingly competitive, MARA decided to adopt a MSTR-esche treasury strategy in mid 2024. In July of 2024, the company’s CEO Fred Thiel stated they would be going “full hodl”, a statement which would be followed by two additional Bitcoin purchases before the end of the summer.
In November 2024, Marathon issued $1 billion of 0% convertible notes due 2030. This was followed up in March 2025, with MARA announcing a $2 billion common stock ATM program, which they intend to partially use to acquire Bitcoin in addition to presumably funding its mining operating business.

Semler Scientific
Semler Scientific, a publicly traded early detection medical company with a focus on Peripheral Artery Disease, made waves back in May 2024 within the Bitcoin community when it announced that it would be utilising Bitcoin as a reserve asset on its balance sheet. The firm purchased 581 BTC for ~$40 million. This was followed by an additional announcement in June that they had acquired 247 Bitcoin for ~$17 million, with additional purchases coming in the following months.
On August 13th 2024, Semler issued a notice for a $150 million common stock ATM program in partnership with Cantor Fitzgerald. Fast forward to April 2025, following a great stretch for BTC’s price performance, the company issued an additional $500 million common stock ATM program.
Semler also issued its own convertible note offering in January. The offering consisted of $85 million of 4.25% convertible senior notes. Semler Scientific currently holds 4,449 Bitcoin worth ~$500 million.

Metaplanet
Metaplanet is one of the most interesting names in the Bitcoin Treasury Strategy cohort, exploding from a hotel company to becoming the best performing stock in Japanese public markets.
Metaplanet started as an unprofitable hotel company in Japan, the company announced its Bitcoin treasury strategy on April 8th, 2024. Metaplanet unwounded its real estate assets and used the proceeds combined with cash on its balance sheet, stock warrants (similar to call options), and most importantly, zero-interest debt from the Japanese debt market, to purchase 98 BTC.
In July 2024, Metaplanet announced its “210 Million Plan”, which was a plan to acquire 1% of the total Bitcoin supply. As part of this plan, the company initiated a moving strike warrants program, the equivalent of an at the money stock facility.
Unlike the other names mentioned in this list, Metaplanet has issued hundreds of millions in non-convertible debt, taking advantage of the zero interest rate environment in Japan made possible by yield curve control, which is the backstopping of the bond market by the government to subsidize demand for bonds and keep rates low. This debt is primarily serviced either through income generation on the company’s Bitcoin holdings, which can be done through strategy such as selling covered calls, as well as the moving strike warrant issuances.
Metaplanet currently holds 8,888 Bitcoin on its balance sheet worth roughly $1 billion.

Twenty One Capital
In April it was announced that Cantor Fitzgerald, SoftBank, and Tether would be teaming up to launch a new Bitcoin treasury strategy company called Twenty One Capital, with Jack Mallers as CEO. The entity will go public on the Nasdaq through a SPAC merger with Cantor Equity Partners (CEP) and is awaiting approval.
The company will be launching with 42,000 BTC on its balance sheet worth roughly $4.5 billion, including ~24,000 from Tether, 7,000 from Bitfinex, and 10,500 from SoftBank. Twenty One Capital also took on commitments for $385 million of convertible senior debt notes as well as $200 million in common stock sales, totaling $585 million designated for Bitcoin purchases at launch.

Other Noteworthy Names
There are various other names on this list include Nakamoto, which raised north of $700 million through convertible debt and common stock sales, Gamestop, who issued $1.5 billion in convertible notes to purchase Bitcoin, Altvest out of South Africa, Boyaa Interactive out of Hong Kong, The Blockchain Group out of France, Meliuz based out of Brazil, and more.
In addition to seeing companies from a variety of jurisdictions replicate MSTR’s capital structure, we have also recently seen the rise of altcoin acquisition vehicles as well; entities that utilise ATM stock issuance and convertible note issuances to acquire long tail digital assets that are generally less liquid, more volatile, and considered riskier overall. This includes DeFi Development Corp (formerly Janover), who now holds nearly $100 million of Solana, Sharplink Gaming, who raised $425 million to buy Ethereum, and even a vehicle called Synaptogenix who plans to raise $100 million to purchase TAO.
With new BTC-TCs popping up left and right, and continuously performing well out of the gate, one must wonder about the market impact and sustainability of this dynamic, especially as asset bubbles typically reach their mature stages upon the introduction of a large amount of new supply from people looking to harvest the excitement.
Moving Capital in Size, A Market Impact Evaluation
The public nature of the BTC-TCs means we’re able to track their BTC acquisitions in full detail, including when they bought, how much, and at what cost. The chart below illustrates this clearly: each blue bar represents a BTC acquisition, while the orange line shows the total amount of BTC held over time. You can see how activity picked up dramatically toward the end of 2024, as more companies began following Strategy’s lead and entered the market with large-scale Bitcoin buys.

Understanding not just how much BTC these entities are buying, but how much their buying moves the market, is essential to evaluating their influence and execution strategy. Using this detailed acquisition data, and leveraging Keyrock’s internal market data, we’re able to assess the market impact that BTC-TCs have on spot BTC markets at large. This requires granular market data, including daily taker buy and sell volumes, to approximate the degree of price movement attributable to each entity’s trades.
The key metric here is Kyle’s Lambda, a standard metric for estimating the market impact, i.e. the price change, per unit of volume traded. Kyle’s Lambda looks at the Taker Buy volume in a market and tell us how much each $1 of volume contributed to that day’s price move. Leveraging Keyrock’s internal market data, we’ve been able to estimate Kyle’s Lambda across all BTC/USDT and BTC/USDT markets on a daily basis dating back to 2020.
Applying Kyle’s Lambda to our internal Keyrock data on BTC markets allows us to quantify how much each BTC-TC acquisition is likely influencing price, and how that impact varies across time, trade size, and market conditions. Note, while Kyle’s Lambda provides a strong proxy for market impact, this approach assumes the market response to BTC-TC flows is linear and isolated, which may understate or overstate impact on volatile or news-driven days. Also note, price impact is not necessarily down to the outright impact of BTC-TC purchase volume, but also the flows front running them, which are difficult to estimate.

In 2025, on days when BTC-TCs were active buyers, their acquisitions accounted for an average of 0.59% of that day’s total Bitcoin price movement. At face value, this suggests a modest impact, BTC-TCs appear to have moved the market very little. However, this figure is skewed by the ‘Cambrian explosion’ of BTC-TCs during this period, with many new entrants buying relatively small amounts of BTC. It’s worth noting that in some cases BTC-TCs have acquired BTC through in-kind share swaps with large holders. An example of this is Twenty One Capital, who made their initial acquisitions by exchanging shares for BTC with Tether and Bitfinex. These acquisitions have no impact on BTC market price whatsoever.
What we find interesting is the days in which there are large BTC-TC acquisitions, reflecting acquisitions from the more established BTC-TCs such as Strategy, Metaplanet, Semler Scientific etc. On these days, we see price impact contributions surging to over 3%, occurring 6 times during this period. This is still muted relative to expectations, and likely reflects strategic order types to limit impact.
There are of course outliers, which are almost always Strategy driven. For example, the peak price impact contribution of ~9.05% just before EOY 24’. This appears to be the exception to muted BTC-TC acquisition price impact, when Strategy gets involved, the price moves materially.
Sustainability and Capital Structure Assessment
To assess the sustainability of these various treasury vehicles, there are several factors to take into consideration. These include the capital structure, such as interest or dividend obligations and the maturity profile of any debt or equity. It’s also important to evaluate cash flow, whether from a core operating business or from BTC yield strategies like covered calls or lending. Additional considerations include the extent to which the company is perceived as a ‘pure play’ on Bitcoin, its track record in executing its BTC acquisition strategy, and the strength of its team, distribution, and investor exposure.
NAV Premium Dynamics
What is a NAV Premium, and Why Does it Matter?
Having established the sheer volume of BTC held in these BTC-TCs, it’s important to clearly define a critical feature of these companies; their NAV Premium. This metric refers to the premium or discount at which their market capitalisation trades relative to the net dollar value of their BTC holdings.
Put simply, the NAV premium measures the difference between a company’s market cap and the fair market value of its BTC per share. If a BTC-TC holds $100 million of BTC and has 10 million shares outstanding, its NAV is $10 per share. If the market price of each share is $15, the company trades at a 50% premium to NAV.
This premium, or discount, generally reflects investor confidence in the company’s ability to generate long-term BTC accretion per share, access capital efficiently, or offer exposure to Bitcoin in a more accessible or regulated wrapper. In that sense, the NAV premium becomes the financial engine that enables BTC-TCs to raise capital, cover liabilities, and expand their BTC exposure over time. However, in the context of this article, we believe that the premium matters explicitly in the context of sustainability. The premium is based on investor perception, and thus is intangible, subjective, and subject to rapid rerating. To fully understand BTC-TCs from a sustainability perspective, we need to be able to explain NAV premium, why it exists, and what will drive it in the near future.
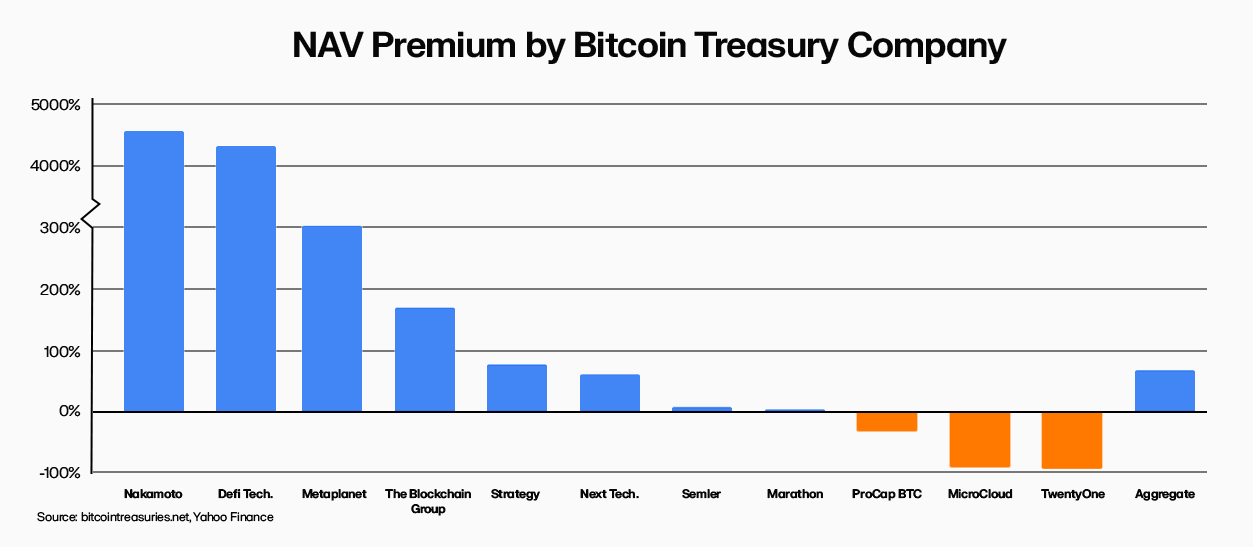
To ground the discussion, we begin by comparing the NAV premiums across BTC-TCs today. The chart below shows the vast dispersion between the premiums of each BTC-TC, driven by a variety of factors discussed below. On aggregate, however, the cohort is currently trading at an ~73% premium to the value of their underlying BTC holdings.
Why Does a NAV Premium Exist?
Understanding why BTC-TCs trade at a premium to their underlying BTC holdings is key to evaluating their investment case. While NAV premiums may appear irrational at first glance, they are often driven by persistent structural dynamics in the capital markets and investor behavior. We identify three primary drivers of NAV premiums in BTC-TCs:
- Structural Demand Dislocations
- Volatility and Trading Optionality
- Bitcoin per Share Accretion
The first driver is persistent structural demand from institutions that are unable to gain direct exposure to BTC. Many pension funds, insurance companies, and large asset managers face internal or regulatory restrictions that prevent them from holding spot BTC or investing in ETFs not yet approved by their compliance departments or national regulators.
In this context, BTC-TCs like MSTR have served as compliant proxies for BTC exposure. By purchasing publicly traded equity in companies that hold BTC on their balance sheets, institutions can access BTC price performance indirectly, without needing custody infrastructure, ETF approval, or direct exposure to the asset itself.
This dynamic is not new. Similar premiums have existed in traditional finance, such as during periods when gold ETFs were unavailable and investors turned to gold miners as a proxy. The result is a structural ‘regulatory premium’ where demand exceeds supply for compliant BTC exposure, driving BTC-TC equities to trade at a premium to the value of their underlying BTC holdings.
The second factor can also be partially explained by the distinct trading characteristics of BTC-TCs. Unlike spot BTC, which trades continuously but with limited embedded optionality, BTC-TCs often exhibit higher volatility and more pronounced liquidity during market hours, making them attractive instruments for traders seeking exposure to directional moves, volatility, or short-term arbitrage.
Equity markets also offer a broader suite of trading tools, particularly those that institutions are accustomed to, such as listed options, leverage through margin accounts, and the ability to short. This allows investors to express more complex views using BTC-TC shares than they could using spot BTC alone. The result from this trading activity is dislocations between NAV and share price as market participants price in both embedded optionality and technical trading flows.
The third, and most powerful long-term justification for a NAV premium, is reflexivity through Bitcoin-per-Share (BPS) accretion. If a BTC-TC trades above NAV, it can issue new equity at a premium and use the proceeds to buy more BTC. Because the shares are issued above NAV, each new dollar raised adds more BTC per share to the existing base.
Investors aware of this dynamic may be willing to pay a premium today if they believe the company will use it accretively to accumulate more BPS over time. This is particularly true in companies like Strategy, where management has clearly articulated and executed a programmatic approach to issuing stock and buying Bitcoin.
This mechanism, identical in financial theory to accretive secondary offerings by ETFs or closed-end funds, can create a self-reinforcing cycle of growth in underlying value. We refer to this as self-reinforcing because the more a company like Strategy increases its BPS over time, the greater investor confidence becomes that they’ll continue to do so, thus justifying a sustained premium to NAV, which in turn is utilised to increase BPS.
In essence, a NAV premium reflects an investor’s willingness to ‘pre-pay’ for expected future accretion. This is the idea that over time, the company will increase its BPS through efficient capital deployment.
This concept of increasing BPS over time was coined by Saylor as “Bitcoin yield”, which is rather fitting, given the success with which Strategy has grown its BPS metric over the years. As can be seen below, Strategy has increased its BPS ~11x since inception. This comes to an annualised growth rate of ~63.9%. The growth has been fairly consistent, but you’ll notice slight pullbacks which represent the raising of further capital through equity issuance, prior to deployment of this capital, i.e. dilution without the subsequent rise in BTC holdings.

A key way to evaluate the rationality of investing in BTC-TCs at a premium to NAV is by analysing what level of future BPS growth would justify that premium. We can then compare this to historical BPS growth rates to see if the market is pricing BPS accretion correctly.
To illustrate, let’s revisit MSTR stock, which trades at a 91.28% premium to NAV. The investor is effectively paying $191 for access to $100 worth of BTC. This only makes sense if they expect the company to grow its BTC at a sufficient pace to close that gap within their investment horizon.
If we take the average investment time horizon of institutional investors at 10 years, we can assess the historical Compound Annual Growth Rate (CAGR) for Strategy’s BPS against the implied BPS CAGR to justify Strategy’s 91.28% NAV premium.
Since inception in August 2020, ~4.9 years ago, Strategy has grown its BPS ~11x, equivalent to a CAGR of ~63.6%, at a fairly consistent rate. This far outweighs the required CAGR of ~6.71% per year for 10 years that an investor would require to break even in BTC terms. The current NAV premium can therefore be seen as justifiable, provided only the company continues to deploy capital accretively.
Note, BTC price does not play a factor here, both metrics are BTC denominated. Thus, if an investor believes that Strategy BPS growth rates will hold long-term, holding MSTR would be far more beneficial in BTC-terms than holding spot BTC.
What Has to Hold for Premium to Sustain?
There are several components that contribute to an environment in which a NAV premium exists. We can consider these components broken into two categories, those associated with the market itself, and those associated with the specific BTC-TC.
In terms of market components, typically all lead back to whether we’re in a risk-on environment. However, explicitly stated these components are whether we are in a BTC bull regime, which ties into institutional interest and demand for the orange coin. This in turn leads to favourable access to capital markets to BTC-TCs in general.
In terms of BTC-TC-specific components, these stem from the BTC-TCs execution ability and treasury discipline, which directly impacts how consistent their BPS growth is. It’s this BPS growth that justifies the NAV premium for investors, beyond those trading the asset for its various financial profiles.
What Could Cause a Premium Collapse?
The sustainability of NAV premiums across BTC-TCs hinges on a fragile equilibrium of market confidence, capital access, and execution quality. Several catalysts could quickly unwind this dynamic.
An influx of new supply of Bitcoin treasury companies could lead to a dilution of capital inflows/demand to BTC-TC’s in aggregate, which could potentially translate to a decline in the premium to NAV for BTC-TC’s across the board.
As with many high-beta assets, BTC-TCs are acutely sensitive to shifts in market sentiment. In risk-off environments, investors may rotate out of volatile speculative vehicles, compressing premiums or flipping them negative.
Further, one of the core pillars supporting BTC-TCs is their ability to accretively increase BPS via equity issuances. If companies issue shares to raise capital but fail to deploy it effectively, investors may punish them with a lower premium.
Finally, we could see investors shift to alternative vehicles if circumstances change, such as investment mandates allowing for direct BTC exposure via ETFs.
Debt and Questionable Cashflows, A Sustainability Assessment
A Spectrum of Leverage
BTC-TCs have collectively raised ~$33.7 billion in capital to fund BTC acquisitions. This consists of ~$20.9 billion in common equity issuance, ~$3.35 billion in preferred equity, and ~$9.48 billion in debt. When assessing leverage and sustainability, preferred equity is included in the leverage ratio calculation because, like debt, it typically involves fixed returns and seniority over common equity, making it functionally similar to debt in downside scenarios.
Of the debt raised, interest rates range from 0% (e.g., Strategy’s and Marathon’s convertible notes) to ~12% (e.g., Bitcoin Well), with terms typically between 1 and 7 years. Most notes are unsecured, and many are convertible, reflecting strategic positioning to benefit from upside in BTC without triggering immediate dilution.
One way to compare companies from a leverage perspective is through the leverage ratio, calculated as (Debt + Preferred Equity) / BTC Holdings. Another is Equity-to-BTC Ratio, calculated as Equity / BTC Holdings Value.
The Leverage Ratio shows how much financial leverage, measured through debt and preferred equity raises, a company has used to acquire each unit of BTC. A higher ratio implies more borrowed capital or quasi-debt has been used per BTC held, indicating a somewhat risker but more capital-efficient structure.
The Equity-to-BTC ratio measures how much equity value, taken as the market capitalisation of the underlying BTC stock, exists per dollar of BTC held. A lower ratio suggests that a company’s equity price is tightly linked to its BTC holdings, and vice versa. Importantly, there are two potential reasons for high ratios. In the range of ~5% – 200% we perceive this as derived from i) outsized investor demand for a high-quality BTC accumulation vehicle and ii) investors pricing in the vehicles ability to accretively acquire BTC going forward, both resulting in an elevated premium (e.g. Strategy). Above this, with examples ranging from ~500% – 8,300%, we simply put the high ratio down to the BTC-TC being valued on diversified offering aside from its BTC holdings, thus making it a poor BTC proxy (e.g. Nakamoto).
Together, these metrics capture both financial risk and BTC concentration relative to equity value, both factors that need to be understood to understand whether a BTC-TC is a good BTC proxy or not.

Among the BTC-TCs, Strategy stands out with a uniquely aggressive capital structure. The company has issued over $8.2 billion in debt, equivalent to 87% of all BTC-TC debt issued, and $3.3 billion in preferred equity to build the largest BTC treasury on record. This capital efficiency is enabled by its exceptional access to markets, with investors consistently underwriting low-cost debt. We predominantly put this down to Strategy’s liquidity, Michael Saylor’s leadership and reputation, and the market perception of Strategy as an established Bitcoin proxy. For example, its 2030 convertible note priced at just 0.625% highlights the favourable terms available to a brand with entrenched BTC credibility.
Beyond Strategy, most other BTC-TCs have taken a relatively conservative approach to capital structure. Marathon Digital holds the second-largest debt position at $1.3 billion, but only 24.7% of its market cap is backed by BTC holdings. Unlike Strategy, this leverage hasn’t been deployed for BTC accumulation alone, it’s largely tied to mining operations. Facing compressed mining margins and poor stock performance, MARA has leaned heavily on shareholder dilution and debt issuance to fund operations. More recently, it has mirrored elements of the Strategy playbook, allocating capital to BTC as a way to revive investor sentiment, but this pivot emerged out of necessity rather than design.
Twenty One Capital, a recent entrant, stands out with $485 million in debt against a $310 million market cap, the highest leverage ratio in the dataset apart from Strategy, suggesting high conviction and a rapid accumulation model. Meanwhile, Altvest presents a unique profile, combining modest debt with $8.5 million in preferred equity issuance, despite only $107k in BTC holdings. This suggests they’re in the very early stages of executing their Bitcoin treasury strategy, with a clear intent to deploy capital. Unlike Strategy, however, Altvest has yet to demonstrate how this capital will translate into BTC exposure, introducing execution uncertainty.
Our Equity-to-BTC ratio serves as a clean, high-signal filter for evaluating capital efficiency. It captures how effectively companies convert equity into Bitcoin exposure, helping distinguish between BTC-native allocators (e.g., Twenty One Capital, Strategy) and operating businesses or fintechs that maintain BTC holdings as a secondary strategic asset. A high equity-to-BTC ratio may reflect early-stage capital deployment, but more often it signals underutilised balance sheet capacity or a lack of BTC-centric strategy. When this inefficiency is paired with elevated leverage relative to market cap, the sustainability of the investment case becomes questionable, particularly in scenarios where premiums to NAV compress or BTC prices decline. In such cases, investors may be exposed to financial risk without proportionate Bitcoin upside.
Most BTC-TCs are still only modestly exposed to Bitcoin on a balance sheet basis. Only a few, notably Strategy, Marathon, and Twenty One Capital, have sized their exposure meaningfully in relation to their overall capitalisation. The rest appear to hold BTC either as a reserve diversification tool or symbolic alignment with the crypto space. Only a handful of BTC-TCs provide clean, scalable Bitcoin exposure. For the rest, structural inefficiencies and limited conviction undermine their utility as BTC proxies.
Debt Maturities
Having established what BTC-TCs are, how much impact they’ve had on the market, and how they structure themselves to capitalise on financial instruments to gain efficient exposure to BTC (some more than others) the next step is to assess their sustainability.
The best way to think about this is that each BTC-TC has obligations that it must meet, in the form of debt interest payments, which includes dividend payments on issued equity. In order to meet these payments, the BTC-TC is either required to have a revenue generating core business, to issue shares to raise further capital, or to raise debt. For context, all debt interest and dividend payments are typically fixed and fiat denominated, meaning that they’re unaffected by market conditions and importantly, BTC price.
Our analysis of debt maturities and free cash flow across BTC-TCs reveals a stark divide in financial runway and sustainability, and thus, as we’ll go on to explain, the extent to which we believe their premium to NAV can be sustained.
To set the stage, let’s explore the debt maturities across the BTC-TCs we’re examining. Or in other words, when do they have to pay back or convert their debt? Debt maturities are clustered in 2027 and 2028, with the former representing the first major wall of refinancing risk.

Several large issuers, particularly Marathon Digital and Strategy, face material obligations beginning in 2027, while smaller issuers like Next Technology Holdings and MicroCloud Hologram see staggered but ongoing debt repayments across the decade. These obligations are relatively modest in absolute terms for most firms but may be significant relative to their free cash flow profiles and cash positions. Note, the majority of these obligations, particularly for Strategy, are convertible debt instruments. This means repayment can be made in equity rather than cash, assuming the company’s stock price remains above the conversion threshold.
In most cases, this assumption is reasonable, given these thresholds are typically set far below current market prices. However, there are of course scenarios in which the company’s stock price could fall below the conversion price. This could arise, for example, due to a broad BTC selloff or loss of investor confidence. In this case, the conversions would need to be repaid in cash or refinanced.
Since many BTC-TC valuations are tightly correlated to Bitcoin price performance, a sharp BTC drawdown could drive down equity value, increasing the risk that conversion thresholds are breached. In that case, the company may be forced to sell BTC reserves or raise capital under unfavorable terms.
Therefore, while conversion mechanics reduce near-term cash strain, they also embed a latent refinancing risk tied to BTC and equity volatility.
Debt Interest and Dividend Payments
Below we’ve laid out the debt interest payment schedule, which includes dividend obligations, across our assessed BTC-TCs. This schedule further illustrates how unevenly these liabilities are distributed. Strategy stands out as the largest consistent interest payer, followed by Nakamoto and Marathon Digital. For most other companies, average monthly interest payments remain below $1 million, with some firms carrying no debt burden at all.

Cash Flows and Reserves
So that’s one side of the sustainability coin, but how about the other side? The side that brings in cash to service these payments. The answer again is one of a stark divide. For the purpose of this analysis, we have taken Operating Cash Flow (OCF) as a cash flow figure that isolates proceeds from underlying core businesses, while disregarding BTC acquisitions and existing debt repayments, which we factor in ourselves later.

The disparity in cash sustainability across BTC-TCs is immediately evident. Some firms, like MicroCloud Hologram and Boyaa Interactive, boast significant cash reserves, giving them a financial buffer even in the absence of strong operational income. However, cash reserves alone is not enough, and that’s where core business performance becomes critical.
Leading the pack on operational performance is Metaplanet, a Japanese public company that has pivoted aggressively into Bitcoin strategy. While originally focused on Web3 and digital asset consulting, the company now operates a hybrid model of blockchain-enabled hotel assets, Web3 advisory, and digital product development. This innovation-driven business has produced surprisingly strong OCF. Similarly, Boyaa Interactive and CoinShares post meaningful positive OCF, driven by online gaming revenues and structured crypto product fees, respectively, placing them firmly in the self-sustaining camp.
On the other end of the spectrum, Marathon Digital shows the largest operational losses. This is due to the high fixed costs of running its mining fleet, combined with volatile BTC production revenues, low transaction fees, and the recent halving, which has compressed margins significantly. Strategy also posts material negative cash flow, reflecting its lack of a revenue-generating core business. The company functions more like a holding vehicle for BTC exposure, with no obvious income stream to support interest obligations.
Together, these charts highlight a clear split between BTC-TCs that are cash-flow generative businesses with resilient operations, and those that are essentially levered BTC exposure vehicles, reliant on capital markets to survive. So what does this actually mean for the businesses themselves, and more importantly, their stocks?
Financing Debt Payments
Given that some of these BTC-TCs do not have a revenue generating core business, they will be forced to issue shares to raise further capital, or to raise debt to cover interest payments. The latter is unlikely unless they’re able to do so at low or 0% interest. The former is much more likely, particularly while NAV premiums are high across the board, as we discussed earlier.
Mechanically, the approach is straightforward. As long as market cap trades above NAV, these companies can issue equity at a premium, using the proceeds to cover obligations, and use any excess capital to accumulate more Bitcoin. In doing so, so long as BTC accumulation outweighs any dilution, they increase their BPS, which in turn drives the NAV per share higher and helps sustain or expand the premium, creating a reflexive, self-reinforcing cycle.
But this model is fragile. It hinges entirely on the persistence of the NAV premium. Should that premium compress or flip negative, either due to waning market confidence, poor execution, or broader risk-off sentiment, the cycle quickly begins to break down.
When NAV trades below the value of BTC held, BTC-TCs lose the ability to issue shares while increasing shareholder value and still being able to cover debt payments. Any equity issuance becomes purely dilutive, making capital raises far less attractive to both management and investors. As capital markets tighten, debt also becomes more expensive or entirely inaccessible, compounding liquidity challenges.
Faced with limited financing options, these companies may be forced to sell BTC to meet interest or refinancing obligations. This undermines the core ‘hodl’ narrative that attracts shareholders in the first place. The dilution risk becomes increasingly punitive, as issuing shares at a discount to NAV destroys shareholder value and may trigger governance backlash or capital flight.
Most importantly, the BTC proxy thesis itself begins to unravel. If BTC-TCs can no longer efficiently raise capital, preserve their BTC stack, or outperform spot BTC on a per-share basis, their justification as listed vehicles for Bitcoin exposure erodes. Valuations compress, financing dries up, and the reflexive cycle that once sustained their premium turns against them.
It is worth noting that there is a world where BTC-TC’s are able to collateralize the Bitcoin on their balance sheets to acquire cash flowing businesses/assets which could allow them to service any interest expenses or dividend payments required. However, this may be a bit further out as BTC-TC’s all seem to currently be in a race to acquire as much BTC as possible to make themselves better proxies by maximizing the BTC per share metric, as well as deepen market volumes and liquidity to allow for more investors to participate in investing/trading activity around the vehicle. A shift in strategy to acquiring cash flowing business/assets with the BTC on the treasury co’s balance should could also add complexities around the evaluation of their business model relative to other vehicles, given investors will then be required to evaluate the operating/investing ability of management which could be a separate skillset than that used to acquire the BTC in the first place. There would also be potential concerns around the price of BTC given the asset would be used as collateral, but in this scenario, BTC-TC’s with more fortified balance sheets would potentially be more attractive for allocators.
In short, the premium to NAV is of the utmost importance here, assuming a BTC-TC doesn’t have a core operating business that can cover debt payments, or is entirely free of debt payments altogether.
For now though, the NAV premium exists, buoyed by market confidence in BTC as an asset and the BTC-TCs abilities to accumulate BTC in an efficient manner. Assuming this premium sustains, and no additional debt is raised, we can estimate the equity issuance each company would require to meet its obligations, based purely on current cash burn and market capitalisation.
The chart below illustrates this by showing the number of quarters each BTC-TC has before depleting its cash balance, and the average quarterly dilution required to cover their funding shortfall through equity issuance alone.

As the data shows, many BTC-TCs are in a strong position, with more than 8 quarters of runway and no current need to dilute shareholders. These include names like Metaplanet, CoinShares, Semler Scientific, and The Brooker Group, all of which are either generating sufficient operational cash flows or have minimal near-term capital requirements.
On the other end of the spectrum, capital-dependent companies such as Marathon Digital, Nakamoto, and DeFI Technologies would face steep quarterly dilution rates, some in excess of 3%, if they were to rely solely on equity issuance to sustain operations. This level of dilution compounds rapidly, especially in a reflexive regime where share price and NAV premium are sensitive to issuance behaviour.
Even among companies with shorter runways but lower funding needs, quarterly dilution still adds up over time, especially if NAV premiums compress. In these cases, dilution becomes the silent tax on shareholder value, gradually eroding NAV per share and weakening the investment case as a BTC proxy.
Assuming the current NAV premiums persist, and that companies avoid taking on new debt while their operating businesses remain flat, the path forward is clear: equity issuance will be the primary tool for survival. The chart above quantifies exactly what that looks like. For some BTC-TCs, dilution requirements are modest or even negligible. But for others, especially those with weak core cash flows and no meaningful runway, the dilution required to stay solvent is already steep. And this is with NAV premiums in place.
If those premiums fade, the equity window closes. Capital becomes expensive, dilution becomes unacceptable, and companies face hard choices: sell BTC, raise at painful terms, or restructure. In that world, the BTC proxy narrative cracks, and the entire investment case for BTC-TCs comes under pressure.
Conclusion and Forward Looking Statements
Conclusion
This article set out with a clear vision, to assess the structure of publicly listed BTC-TCs as vehicles for BTC exposure. In doing so, we’ve assessed the sustainability of their financial models, with a focus on how they fund BTC purchases, manage liabilities, and maintain NAV premiums. We’ve then taken this a step further by evaluating and identifying which BTC-TCs are most exposed to dilution or potential solvency risk based on cash flow profiles, debt maturity timelines, and reliance on capital markets.
To recap, here are our key findings. The BTC-TC universe collectively holds ~722k BTC, equivalent to ~$77b, with Strategy alone accounting for ~83% of this figure. Despite such substantial holdings, NAV premiums remain high across the board, with an aggregated average of ~73% MCap premium to underlying BTC holdings. This allows companies to issue shares accretively, but this reflexive mechanism is fragile and very sensitive to sentiment and market conditions. Several BTC-TCs (Semler, Metaplanet, CoinShares) are in strong financial positions with long-term runway reserves and minimal dilution risk. On the other side of the coin, however, there are others (Marathon, Nakamoto) that could face >3% quarterly dilution to service debt interest and dividend payments if NAV premiums hold.
We highlighted some key risk factors when assessing BTC-TCs as vehicles for BTC exposure, with a summary as follows. The primary risk factor is a compression of NAV premiums, which could arise from excess supply of new BTC-TCs, diluting flows across the board, as well as individual company or market sentiment deterioration. In the event of compressed NAV premiums, BTC-TCs lose the ability to issue equity accretively and cover obligations. Moreover, crowding of convertible debt maturities, which we see between 2027 and 2028, may stress the system if BTC price or sentiment drops. From a company-by-company perspective, low free cash flow coverage means many BTC-TCs are still reliant on capital markets to meet recurring obligations, so this is one of the key factors to assess prior to investment.
So, with the information and context we’ve been able to obtain, where do we see this going in the future? For completeness, we’ve broken this down into a bull, base and bear case, with assigned probabilities.
Bull Case
- BTC appreciates >50% through 2025
- NAV premiums expand >100%
- BTC-TCs are dominant BTC allocation tools.
Our bull case is optimistic, and one to which we assign a relatively high probability at 30%. In this scenario, risk assets perform particularly well driven by liquidity expansion and fiscal deficits, pushing BTC to over $160k by EOY, a 50%+ move from current prices.
With market sentiment high, particularly sentiment around BTC, this adds fuel to the NAV premium flywheel, and pushes the average NAV premium up from ~73% to over 100% as institutional investors rush to gain exposure to BTC. As such, BTC-TCs are able to issue shares in a highly accretive manner. This results in BTC-TCs outperforming spot BTC as leveraged proxies. In this scenario, we see new listings and product innovation aiding in BTC-TC sector growth, with BTC-TCs leading as the dominant BTC allocation tools.
Base Case
- BTC appreciates 25% through 2025
- NAV premiums sustain at 30 – 60%
- Selective BTC-TCs deliver alpha; others track BTC or underperform.
Our base case is still relatively optimistic, but within far greater reason. Risk assets perform moderately well, again driven by liquidity expansion but to a lesser extent than our bull case, pushing BTC to ~$135k EOY, a 25% move from current prices.
This maintains a steady sentiment surrounding BTC, and as such upholds the 30 – 60% NAV premium range, very similar to the state we find them in today. This results in moderate BTC NAV dilution, but far more manageable from a sector level. We see dilution concentrated around smaller BTC-TCs unable to raise cheap capital, or without sustainable core operations. Larger, more reputable, BTC-TCs on the other hand, will sustain next to no BTC NAV dilution. In this scenario, selective BTC-TCs deliver alpha, while others track or slightly underperform BTC.
Bear Case
- BTC price stagnates or draws down ~20% through 2025.
- Excess competitors flood the market with new supply for BTC-TCs that outweigh demand.
- NAV premiums collapse.
- BTC-TC model questioned; equities underperform BTC significantly.
Our bear case is far more pessimistic, but remains a lower likelihood for us. In this scenario, BTC price stagnates or draws down ~20% through EOY. In addition, part of the bear case includes a flooding of the market with excess supply of BTC-TCs into the public market, outweighing the rate at which demand is able to keep up, causing a compression of NAV premiums across the board.
This would lead to NAV premium collapse, thus making equity issuance punitive, or simply impossible for BTC-TCs. With no ability to raise capital via issuance, and under the assumption that terms for raising debt become far less favourable in these conditions, firms would be forced to sell BTC or default on obligations. As such, the BTC proxy thesis would break, and the BTC-TC model called into question, with equities underperforming BTC significantly.
Final Takeaways
The BTC-TC model offers leverage and liquidity to BTC exposure, but with risk asymmetry around financing. As mentioned, sustainability depends on premium maintenance, operational FCF, and individual debt profiles.
Investors must distinguish between ‘reflexivity-funded’ BTC-TCs and those with cash-flow-backed strategies, to get the highest quality long term investment exposure.

Stay up to date
Get the latest industry insights, in-house research and Keyrock updates.
This site is protected by reCAPTCHA and the Google Privacy Policy and Terms of Service apply.