

18 May 2026
Key Insights: A Tale of Two Capitals
Two Capitals
Every Monday, we deliver a concise yet comprehensive briefing to help you navigate the week ahead.
Our weekly market dashboard brings together key insights across Macro, Crypto, and Onchain activity, distilled into a clear, actionable format. Whether you’re managing risk or spotting opportunity, start the week informed and aligned.
Join our Telegram Channel to get it delivered directly to your phone.
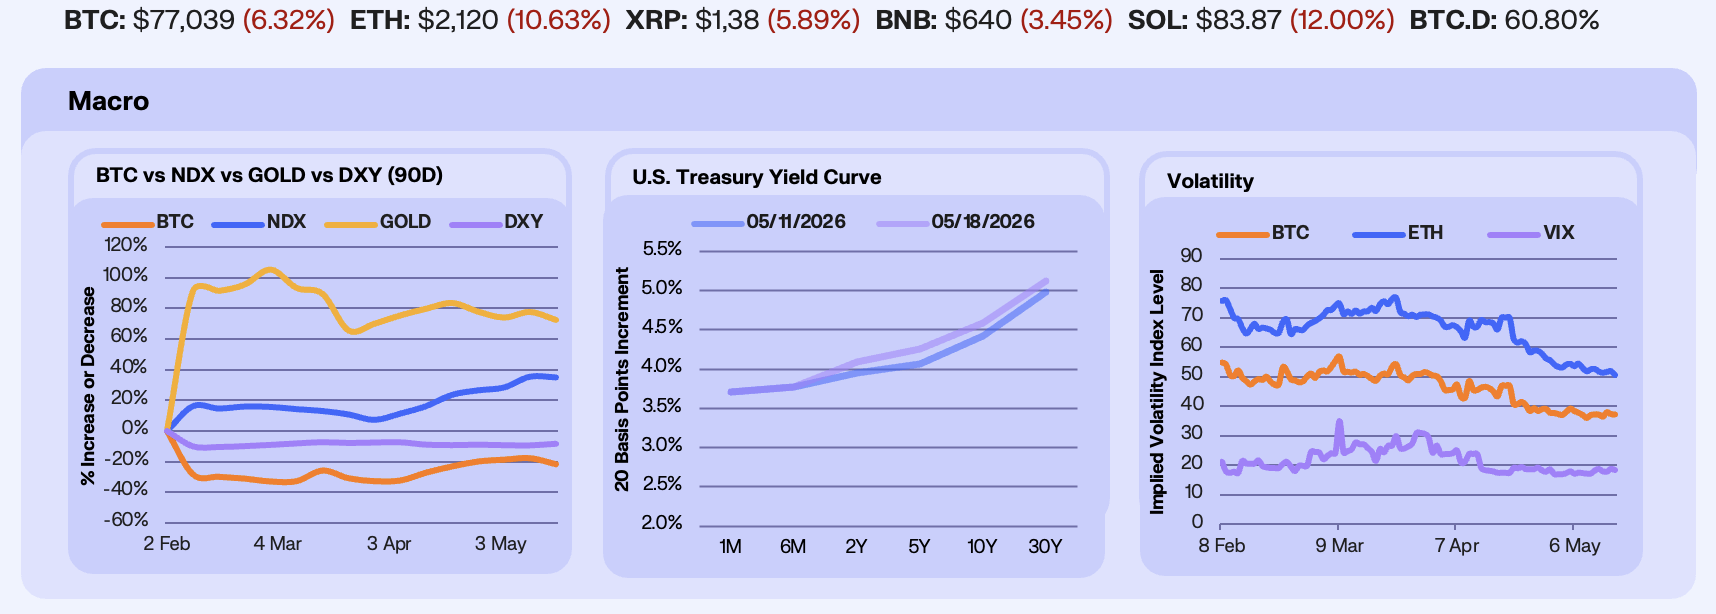
The week stacked two regime transitions inside five trading days. Kevin Warsh was confirmed as the 17th Fed chair Wednesday at 54-45, the closest modern-era margin, with Powell’s chair term ending Friday but Powell retaining his governor seat through January 2028, the first chair to stay on the Board since Marriner Eccles in 1948. Trump simultaneously arrived in Beijing for the first sitting-president state visit in nearly a decade, with a joint readout outlining a three-year “strategic stability” framework. DXY rose +1.17% to $99.20, Gold fell -2.89% to $4,544, NDX slipped -0.37% to $29,125, and BTC closed -4.83% at $76,888. The dollar took the rate-differential bid, gold sold on real yields, NDX faded NVDA’s mid-week rerating to a fresh 52-week high on the China-trip flip and Cisco’s Wednesday capex revision by Monday’s close, and BTC carried the rate shock through the weekend.
Yields sold off across the belly and long end as April inflation reset the path. CPI Tuesday printed +0.6% MoM and +3.8% YoY headline, the hottest annual reading since May 2023, with core at +0.4% MoM and +2.8% YoY, energy contributing +3.8% MoM. PPI Wednesday delivered the second shock at +1.4% MoM headline, the largest since March 2022, with trade services +2.7%, the cleanest tariff pass-through signal in the data. Year-end Fed hike odds reset to roughly 40% from 15%, with Bessent stating that one or two more hot prints precede substantial disinflation, the cover for a Warsh hold through July.
VIX added +7.21% to 18.43 as NDX gave back its mid-week high, the bid sitting in event hedging into Friday’s chair transition and Tuesday’s CPI, while BTC 30-day ATM IV rose +0.57% to 37.37 and ETH 30-day IV fell -3.58% to 50.57, the divergence we flagged last week widening rather than closing. The front-end repriced sharply higher week-on-week, with both BTC and ETH short expiries up around 10–12 vols, while longer maturities were broadly stable. ETH term structure is now downward slopping, reflecting short-dated event/range-break risk rather than a broad repricing of long-dated volatility. ETH skew, defined as put minus call, jumped back above the 90th percentile area, while convexity bounced from low levels, showing renewed demand for downside/tail protection.
Our Take: The equity rally is a handful of AI names doing the work, with breadth narrow enough to break on a single-name miss. We stay long that complex into NVDA’s May 20 earnings. Iran keeps oil prices high and inflation sticky through the same window, which keeps Treasury yields and the dollar elevated. BTC stays supported on the institutional spot floor into the June FOMC.
Flushed
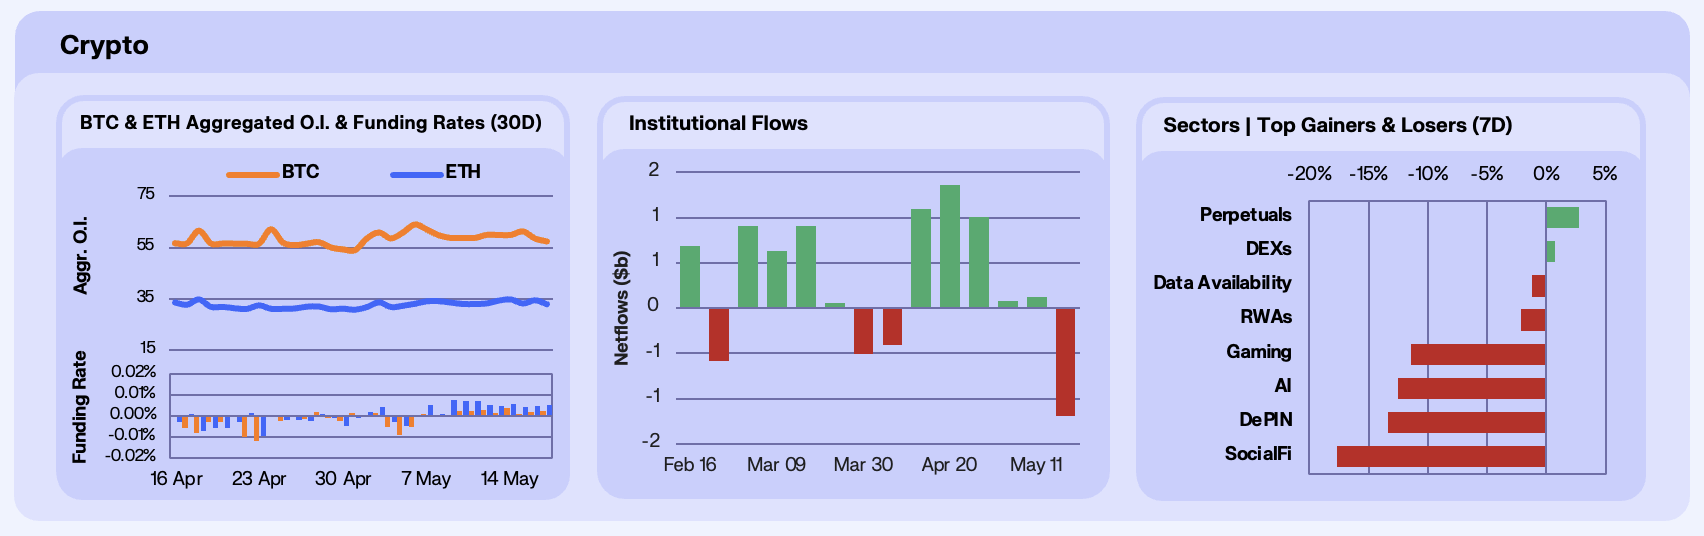
BTC open interest fell -2.41% WoW to $57.41B, after building to $61.40B by Friday before unwinding -6.5% over the weekend. ETH OI was essentially flat at -0.33% to $32.85B, the weekend unwind concentrated in BTC. Funding stayed positive on both majors but compressed through the week, with BTC funding ending unchanged at +0.0022% and ETH funding falling from +0.0069% to +0.0050%. The shape says perp longs treated the chair handover and CPI shock as a buyable dip mid-week, only to be flushed alongside spot through the weekend.
The six-week BTC spot ETF inflow streak broke this week. Bitcoin ETFs recorded -$995.5M in net outflows after $3.47B cumulative inflows from April 5 through May 10, with the prior week’s +$631.6M reversed and exceeded inside five sessions. Ethereum ETFs added -$255.2M, while Solana products bucked the trend at +$58.2M. The reversal comes inside a week where crypto-native leverage also unwound, putting institutional and crypto-native positioning on the same side rather than offsetting each other.
Crypto sectors weakened broadly with 13 of 15 categories down on the week. Decentralized Perps led the gainers at +2.78% with DEX at +0.63%, both carried by HYPE +7.1%. AI tokens fell -12.45% with ICP -23.6%, TAO -17.5%, and SN0 -17.4%, materially worse than NDX -0.37% through the same window. SocialFi led the broad drag at -17.73% (GAL -39.2%, PUMP -20.4%), followed by DePIN -13.37%, Gaming -11.40%, and L2 -10.94%.
Our Take: Although it was a breather week for ETFs and BTC sits back under $80k, parts of the altcoin market are starting to spring up off their lows. HYPE, VVV, and ZEC are putting in real strength even as the broader tape stays heavy. Breadth is bad but the decoupling is real. We’re watching whether the leadership broadens into the second tier of alts and whether the June FOMC delivers the macro reset that lets a proper rotation form. These three are the early read on what leads when the overhang lifts.
Onchain Yield Bid
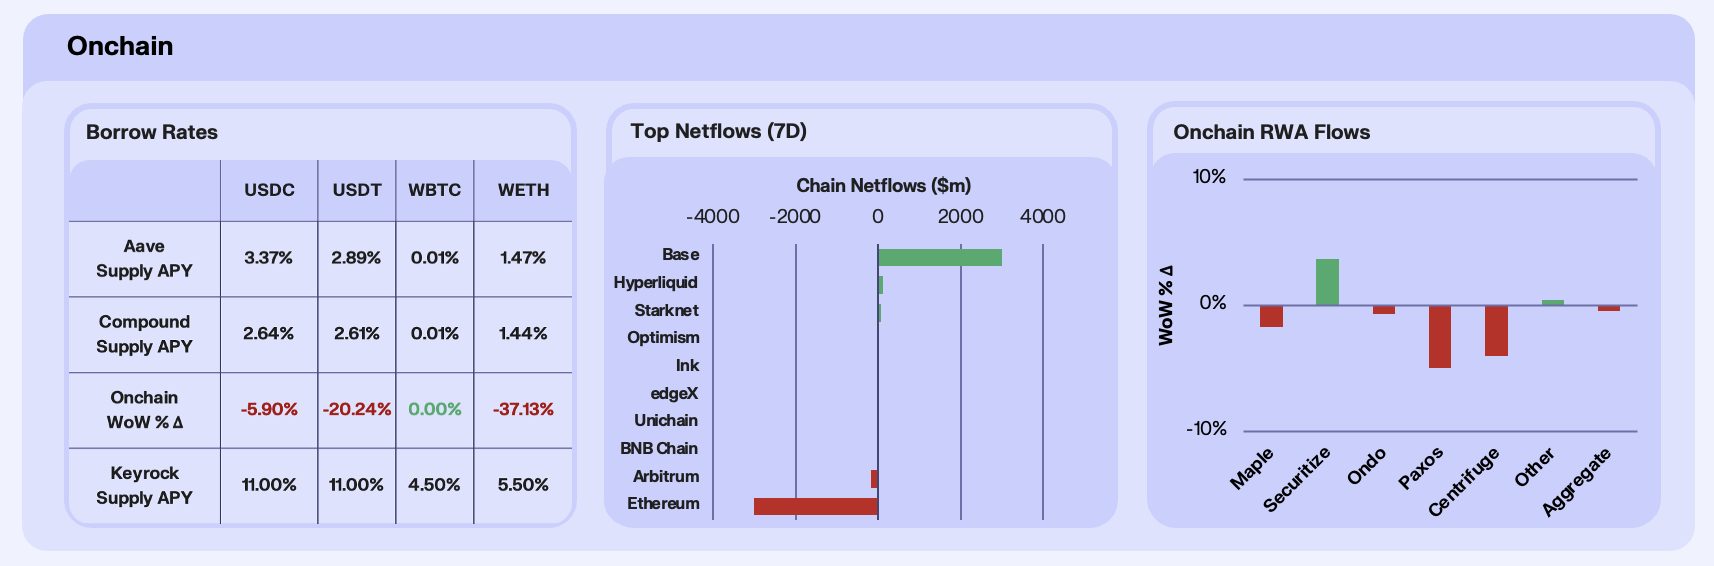
Stablecoin lending rates on Aave compressed sharply as fresh deposit supply flooded the pools. USDC supply APY fell -5.90% WoW, USDT -20.24%, and WETH -37.13%. The driver was a deposit surge concentrated in two assets, with Aave USDT supply more than doubling from $183M to $371M, WETH expanding +26.59%, and USDC inching up +4.62%. The pattern reads as capital seeking onchain yield refuge rather than borrowing demand returning, and the WETH leg tells a story in itself, with holders depositing for 1.47% rather than borrowing against the asset, a positioning signal worth weighing alongside this week’s spot ETH ETF outflows.
Chain-level flows were dominated by a sharp L2 rotation which saw Base lead at +$1.4B in net inflows, the strongest weekly print of any chain, driven by sustained activity in Aerodrome, Morpho, and the broader Base DeFi flywheel without a single headline catalyst. Hyperliquid posted +$106M, with the trigger being the first regulated TradFi on-ramps into the ecosystem, as 21Shares THYP launched on Nasdaq on May 12th and Bitwise BHYP followed on NYSE on May 15th, layered on Coinbase and Circle’s deployment of USDC as the primary quote asset for Hyperliquid’s AQAv2 perp DEX. On the outflow side, Ethereum bled -$1.3B as U.S. spot ETH ETF redemptions exceeded $255M in weekly aggregate, with single-day prints of $131M on May 12th and $65M on May 15th doing the heavy lifting. Arbitrum shed -$261M as the direct mirror of the Base and Hyperliquid inflows, with traders and LPs rotating capital toward higher-momentum venues.
RWA AUM fell -0.41% WoW in aggregate, breaking a two-week growth streak, with Securitize the lone positive standout. Securitize gained +3.69% on back-to-back catalysts, with BlackRock filing with the SEC for a second tokenised fund structure in partnership with Securitize, and Grove launching its Basin facility on May 14th, a $1B daily stablecoin liquidity pool enabling instant USDC redemptions for tokenised RWAs with BUIDL as a core partner. Ondo slipped -0.66% despite Ondo Global Markets crossing $1B TVL in tokenised equities, representing roughly 70% of the issuer market and doubling since January, with core treasury products like OUSG and USDY seeing minor rebalancing into the milestone. Centrifuge declined -4.02% paradoxically off the same Grove Basin launch, where Janus Henderson’s JTRSY was included and the easier redemption pathway enabled net outflows that outweighed the structural upgrade. Paxos fell -4.99% on PAXG-linked gold price weakness, while Maple slipped -1.71% despite integrating with Ink L2 on May 13th to deploy syrupUSDT and syrupUSDC vaults.
Our Take: Last week we framed the onchain economy as concentrating around specificity, with Hyperliquid for derivatives, Ethereum for post-Pectra staking, and Securitize and Ondo for institutional RWA rails. This week’s data confirms the thesis for Hyperliquid and Securitize and breaks it for Ethereum. The HYPE ETF launches are the structural shift to watch, the first regulated wrapper feeding Hyperliquid perp fees and HYPE buybacks to institutional capital. The quietest signal is the Aave deposit surge, where USDT supply more than doubled to $371M and WETH added $70M, dragging rates to floor-converging levels. That is capital seeking onchain yield refuge rather than borrowing demand returning, and the WETH leg reads as a positioning signal in itself, with holders depositing for 1.47% rather than borrowing against the asset. The proximate test is whether HYPE ETF AUM accelerates past the first-week trickle into Friday and whether the ETH ETF outflow streak breaks before the next FOMC. If both hold, the L2-rotation trade is the cleanest onchain expression for the rest of Q2.
Bitcoin’s Reserve Exodus
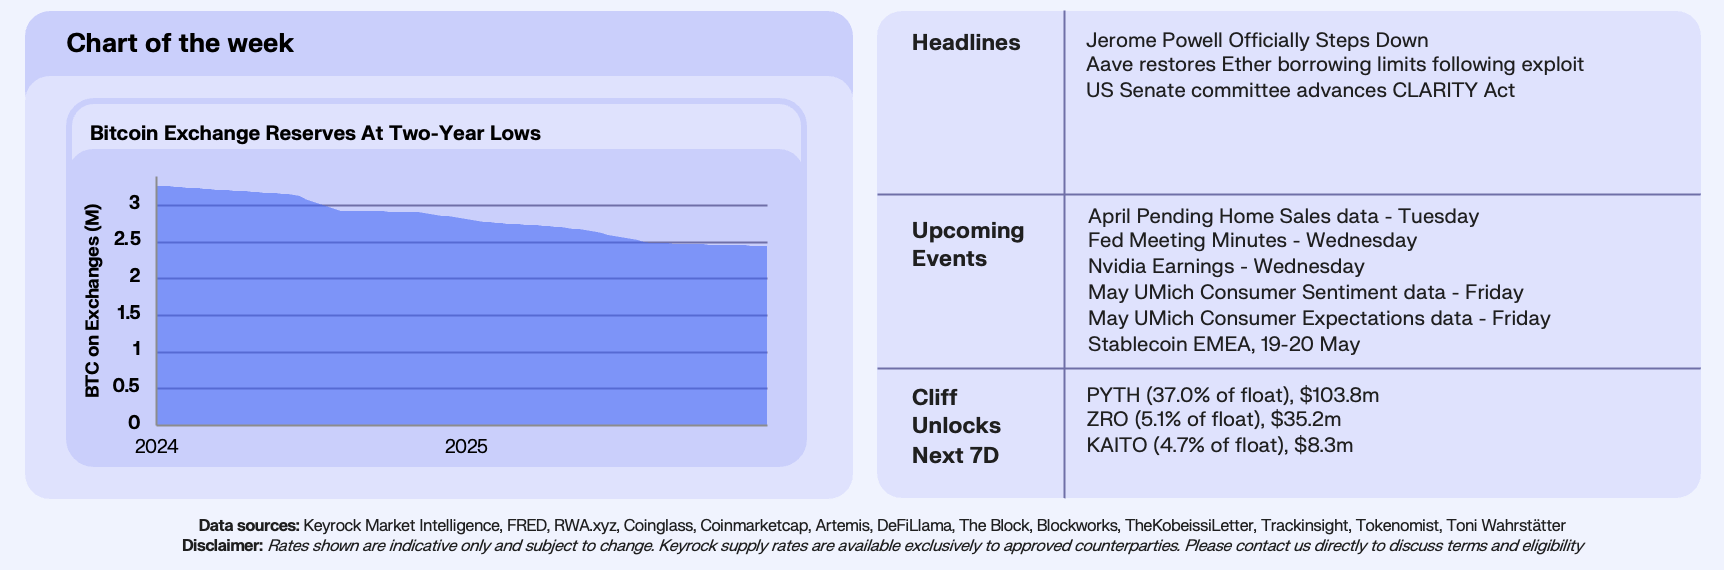
This week’s chart tracks Bitcoin held on centralised exchanges. The series opened at 3.27M BTC and closed at 2.45M, a withdrawal of roughly 820,000 BTC in two years. For context, Strategy’s entire balance sheet sits at 815,061 BTC at the last reported count. The drain of BTC on CEXes has not run at a constant rate, rather the window opened with a slow grind, where reserves fell only 120,000 BTC between May and October 2024 as institutional positioning waited on the US election. Reserves then dropped 220,000 BTC in the eight weeks from early November 2024 to early January 2025 as the outcome resolved and the post-election bid took hold. A flatter stretch through 2025 was followed by a second acceleration from mid-October 2025 to early January 2026, removing a further 180,000 BTC in roughly ten weeks. Reserves moved down to lows of 2.45M on the 18th May
The longer-term mechanism is well known as the spot Bitcoin ETF, which launched in January 2024 and redirected institutional demand toward Coinbase Custody and other regulated custodians rather than exchange order books. Strategy and other public treasury companies layered on top, with 1.72M BTC held between Strategy and IBIT alone as of late April, roughly 8.2% of circulating supply, none of which sits in liquid exchange inventory. Every ETF inflow week and every STRC-funded accumulation print is also a permanent withdrawal from the float that market makers can lean on. The cleanest comparison is to the gold market after 1971, where the bulk of physical bullion sits in central bank vaults and ETF custodians rather than dealer inventory, and where the price impact of marginal flows is amplified accordingly.
Our Take: The interesting feature of the chart is that the rate of departure is now approaching zero. The drain decelerating into the 2.45M region tells us the supply that wanted to leave has largely already left, and what remains is the working float of active traders. The CLARITY Act clearing the Senate Banking Committee by a 15-9 vote on the 15th May 2026 reinforces the setup, since regulatory clarity pulls more institutional supply into long-term custody rather than back through trading venues. Our bias is that the next positive catalyst, whether a Fed cut, a sovereign Bitcoin announcement, or a CLARITY Act floor vote, will produce a steeper price response than any catalyst this cycle has produced. The signal we are watching is whether reserves hold the 2.45M level through quarter end. A break lower into a positive headline is the cleanest bullish setup we have seen. A reversal back above 2.50M without one would be the first sign that the marginal seller is back.
Join our Telegram Channel to get it delivered directly to your phone.

Stay up to date
Get the latest industry insights, in-house research and Keyrock updates.
This site is protected by reCAPTCHA and the Google Privacy Policy and Terms of Service apply.