

Less than 0.1% of the global financial market lives onchain. That number is about to shift dramatically.
The gap between promise and reality
The global financial system holds roughly $400 trillion in assets. Bonds, equities, commodities, real estate, private credit. The infrastructure that underpins these markets was built decades ago. It works. But it moves slowly, settles expensively, and locks out billions of potential participants.
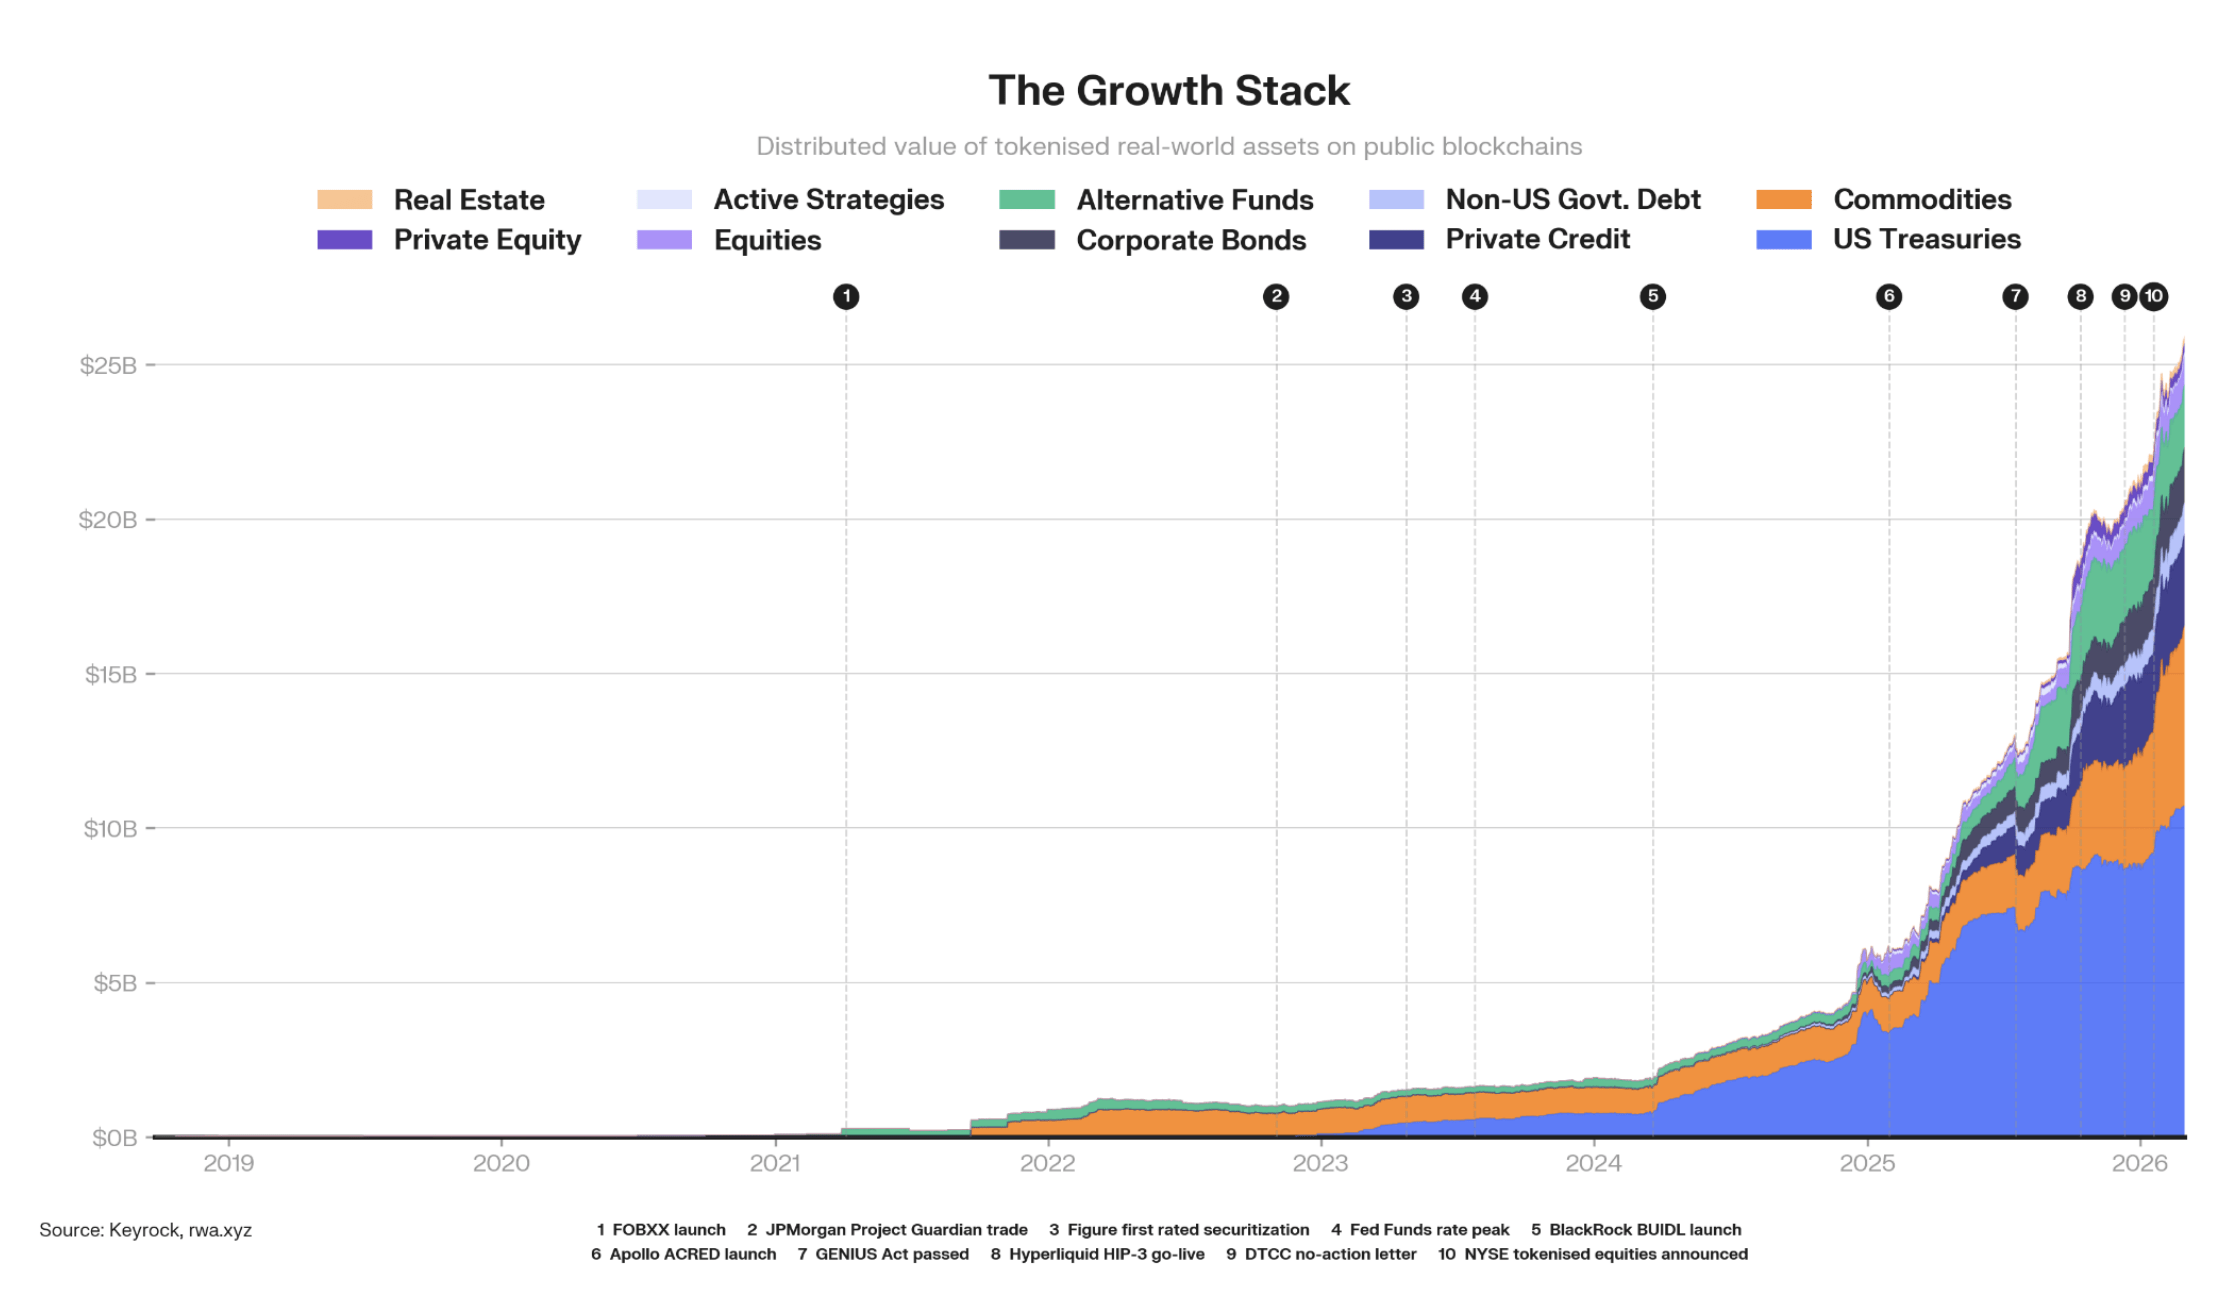
Tokenised assets today represent less than 0.1% of that $400 trillion figure. Freely transferable assets onchain stand at approximately $27 billion. That is a rounding error on a rounding error.
Yet the direction is unmistakable.
Base case projections: $400B by 2030
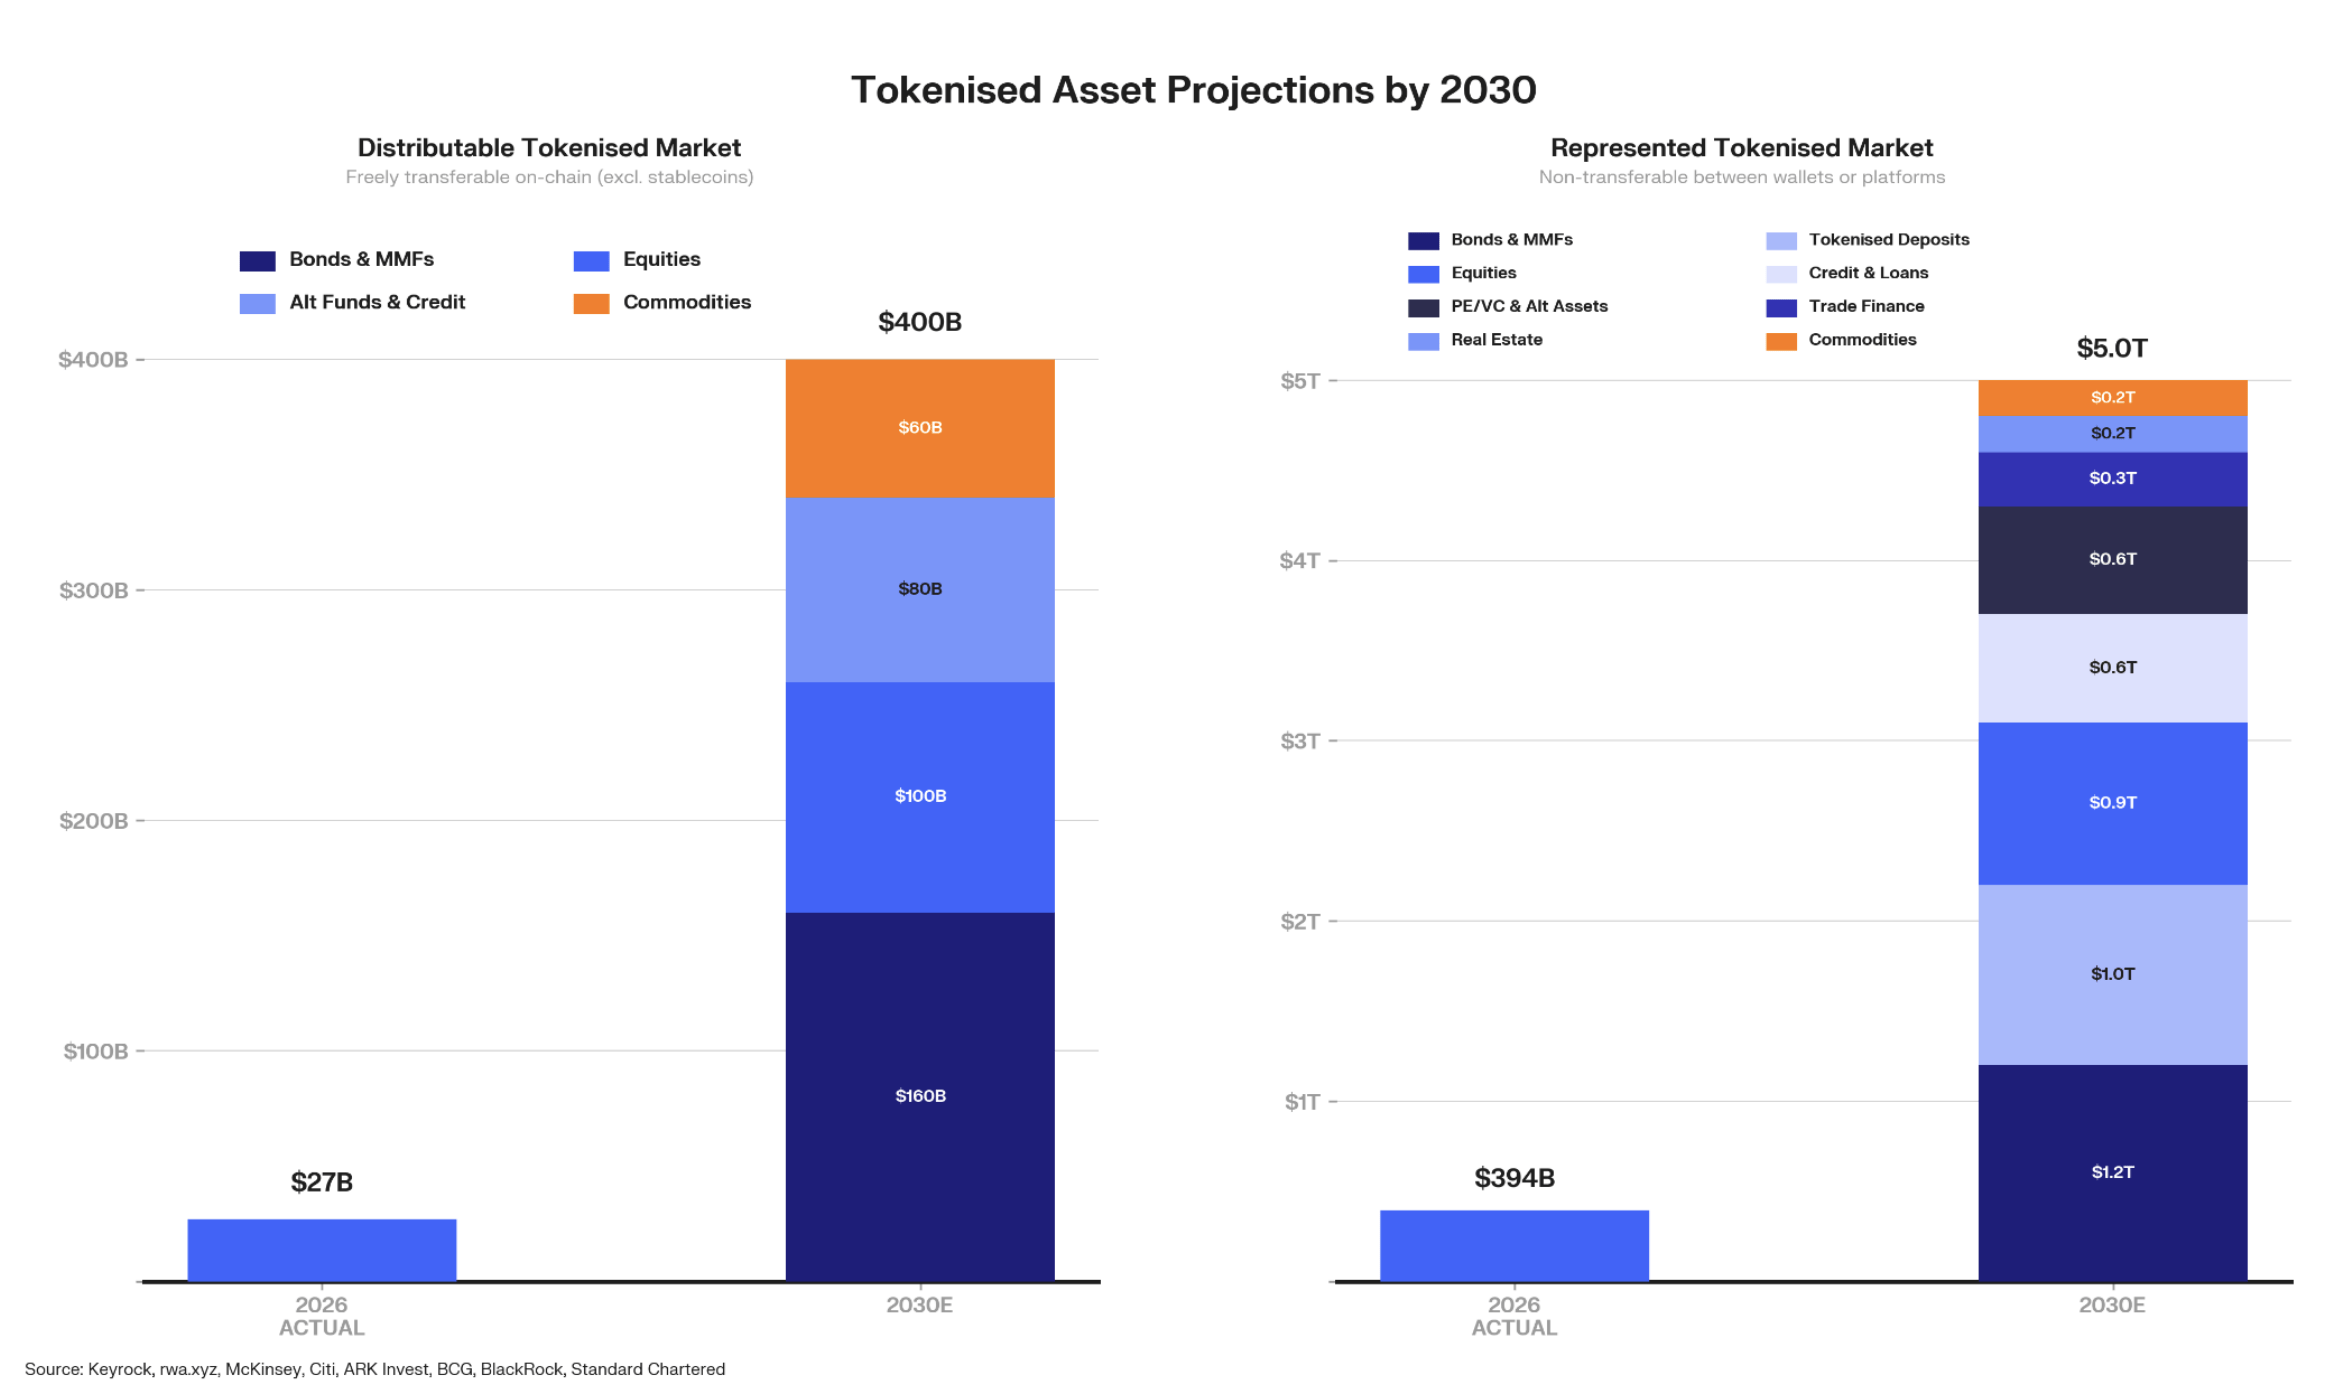
We project freely transferable tokenised assets to grow from $27 billion to $400 billion by 2030. That is a roughly 15x increase in under five years. The broader category of real-world assets tracked on blockchains reaches $5 trillion in the same window.
These are not speculative figures. They build on observable adoption curves in tokenised treasuries, where institutional capital has already validated the model. They account for regulatory timelines, infrastructure maturity, and distribution network expansion.
The base case is conservative. It assumes friction persists. It assumes regulation arrives unevenly. It assumes most traditional asset managers move slowly.
Even under those constraints, the maths works.
Where the $400T sits today
The results tell a clear story. Treasuries lead with a readiness score of 27 out of 30. Equities follow at 22. Commodities score 21, driven by extraordinary DeFi collateral use. Alternative funds sit at 17. Private credit trails at 14.
You can explore how we built these scores and what they mean for sequencing in our RWA readiness framework.
Concentration reveals institutional intent
Large allocators are testing infrastructure, verifying settlement mechanics, and building compliance frameworks. The concentration is a feature, not a flaw. It signals institutional validation.
But retail adoption is already visible in certain segments. Equities and alternative funds skew towards smaller participants, with average trade sizes of $566 and $2,100 respectively. These are accessible entry points.
The pattern mirrors early internet adoption: institutions build the rails, retail follows once the experience improves.
Why this market grows non-linearly
Tokenisation does not expand at a steady pace. It accelerates when multiple conditions converge: regulation clarifies, infrastructure matures, liquidity deepens, and distribution scales.
We see 2027 as the first year all four pillars mature simultaneously. When that happens, asset issuers who have been running pilots convert to production. Distributors who have been watching begin allocating. The $27 billion base becomes a launchpad.
The derivatives layer is already accelerating ahead of the spot market. RWA perpetuals grew 40x in six months, reaching $67 billion in monthly volume. Derivatives do not need the same regulatory clarity as spot issuance. They lead.
The liquidity challenge that determines the timeline
Market size projections are only as credible as the liquidity infrastructure supporting them. A $400 billion market in tokenised assets requires deep, reliable secondary markets. Today, that gap remains the single largest constraint on growth.
Most tokenised assets have thin order books, wide spreads, and limited price discovery. Investors can buy in but struggle to exit at fair value. This is the problem Keyrock is solving through NAV-anchored pricing and instant-redemption vault infrastructure.
You can read our full analysis of the secondary market liquidity gap and what it takes to close it.
What the $400T future looks like
The endpoint is not a world where every asset moves onchain overnight. It is a world where tokenisation becomes the default issuance format for new financial products. Where secondary markets operate 24/7 with programmatic settlement. Where a pension fund in London and a retail investor in Lagos access the same instrument on the same terms.
Dean Khan Dhillon of RWA.xyz captures it precisely: “There is a collision of two worldviews.” Traditional finance sees blockchain as a cost-reduction tool. Crypto-native participants see it as a new financial architecture. Both are right. The convergence of these perspectives is what powers the $400 trillion opportunity.
We are at less than 0.1%. The trajectory to $400 billion by 2030 is grounded in data, not speculation. And beyond that, the path to trillions becomes a question of when, not if.
Frequently asked questions
How big is the tokenised assets market today?
Tokenised assets currently represent less than 0.1% of the approximately $400 trillion global financial market. Freely transferable tokenised assets stand at roughly $27 billion as of early 2026.
What is the projected market size for tokenised assets by 2030?
Under the base case, freely transferable tokenised assets grow from $27 billion to $400 billion by 2030. Broader real-world assets tracked on blockchains could reach $5 trillion in the same timeframe.
Which asset classes are leading tokenisation adoption?
Tokenised treasuries lead with the highest readiness score of 27 out of 30, followed by equities (22), commodities (21), alternative funds (17), and private credit (14). Treasuries benefit from standardisation, high valuation frequency, and strong onchain demand.
Why does tokenisation matter for global finance?
Tokenisation enables 24/7 transferability, programmable settlement, fractional ownership, and composability with DeFi protocols. These features reduce costs, increase market access, and unlock liquidity in previously illiquid asset classes.