

Prediction Markets: The Next Frontier of Financial Markets
Prediction Market Accuracy: Brier Scores, Data & Comparisons (2026)
540,000+ resolved markets. Two major platforms. One conclusion: prediction markets produce the most accurate publicly available probability estimates of any known forecasting method.
That is not a claim. It is what the data shows. We analysed performance across Kalshi and Polymarket using Brier scores — the standard metric for evaluating probabilistic forecasts — and compared the results against polls, expert panels, intelligence analysts, and weather models. Prediction markets win on every front.
What Is a Brier Score and Why Should You Care?
A Brier score measures the accuracy of probabilistic predictions on a scale from 0 to 1. Zero means perfect prediction — every forecast matched reality exactly. One means maximum inaccuracy. The formula calculates the mean squared difference between the predicted probability and the actual binary outcome.
What makes it powerful is that it rewards calibration, not just correct calls. A market that prices an event at 70% and sees it happen 70% of the time scores well. A market that prices everything at 90% and is right only 70% of the time gets penalised for overconfidence.
For reference, a Brier score of 0.25 equals random coin-flip guessing. Anything below that represents genuine forecasting skill. The lower, the sharper.
The Numbers: How Accurate Are Prediction Markets?
Polymarket correctly prices outcomes 90–95% of the time. Both Kalshi and Polymarket achieve Brier scores that cluster around 0.09 — placing them ahead of nearly every alternative forecasting method in existence.
Compare that against the field:
- Prediction markets (Kalshi & Polymarket): ~0.09
- Weather forecasting models: 0.14–0.15
- Sports betting (sportsbooks): 0.18–0.22
- Intelligence community forecasters: 0.20–0.25
- Traditional polls: 0.27–0.31
Prediction markets do not just beat polls. They outperform them by a factor of roughly three. They outperform professional weather models backed by decades of refinement and billions in satellite infrastructure. They decisively beat the intelligence community’s best human forecasters — including those trained in structured analytical techniques.
Read that list again. It is not close.
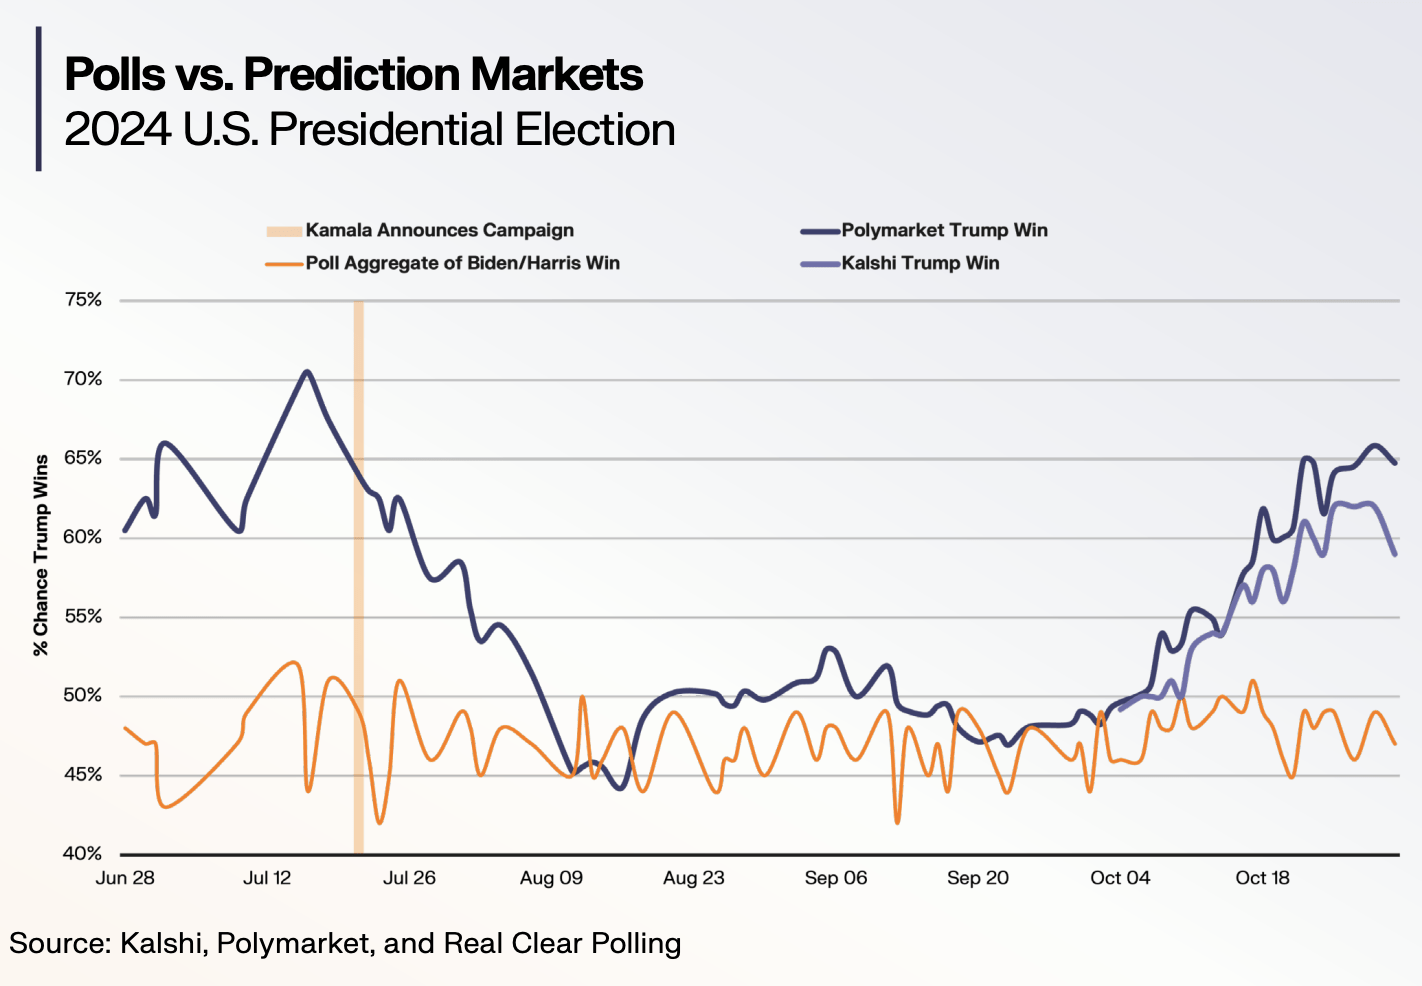
Prediction Markets vs. Polls: The Historical Record
This is not a one-cycle anomaly. A landmark study of the Iowa Electronic Markets tracked performance across five U.S. presidential elections from 1988 to 2004. Market forecasts beat traditional polls in roughly 75% of all observations.
That result held across different political environments, different candidates, and different polling methodologies.
Polls suffer from well-documented structural flaws: response bias, the “shy voter” effect, difficulties reaching representative samples, and the challenge of converting stated preferences into turnout predictions. Prediction markets sidestep all of this. They aggregate revealed behaviour — people putting capital behind their beliefs — not stated preferences.
Trust in traditional information sources has also cratered. According to Gallup, only 31% of U.S. adults now trust the news media — a historic low. That credibility gap has created demand for alternative, verifiable information sources. Prediction markets fill it by offering transparent, real-time probability signals anyone can audit.
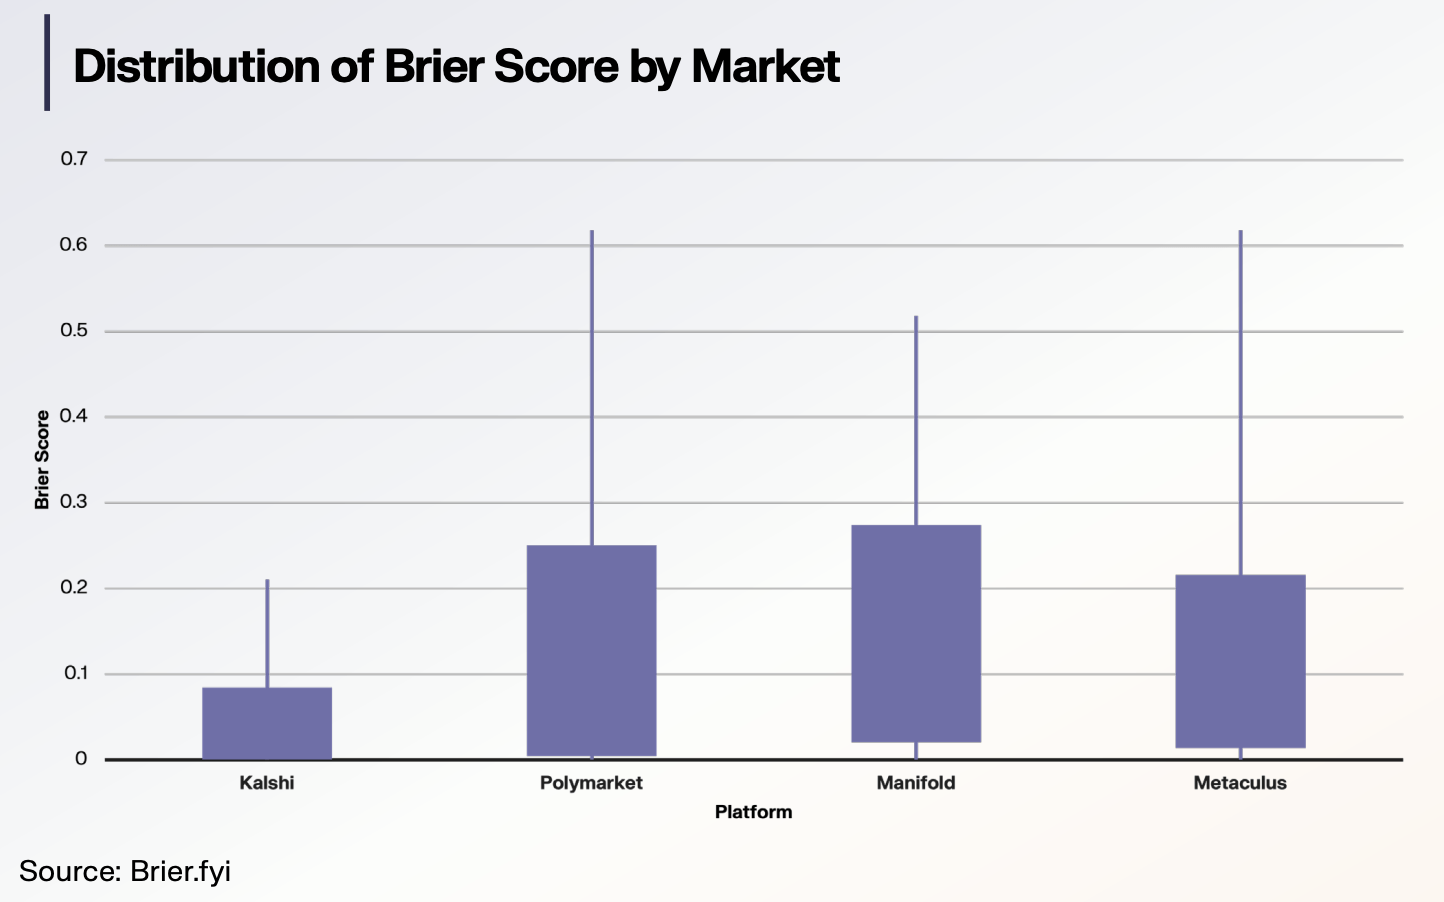
Kalshi vs. Polymarket: Accuracy Distribution
Both platforms achieve headline Brier scores near 0.09. The distribution of that accuracy, however, differs.
Kalshi’s Brier score distribution is tighter and more concentrated. As a CFTC-regulated exchange, Kalshi focuses on economic, political, and weather event contracts with clearly defined resolution criteria. The result: a portfolio where most markets resolve with high precision and little ambiguity.
Polymarket’s distribution is broader. It offers markets on entertainment, crypto, culture, and meme-driven events alongside political and economic contracts. Some categories are inherently harder to forecast, introducing more variance. But Polymarket’s best-traded markets — elections, macro events, major geopolitical outcomes — match Kalshi’s accuracy.
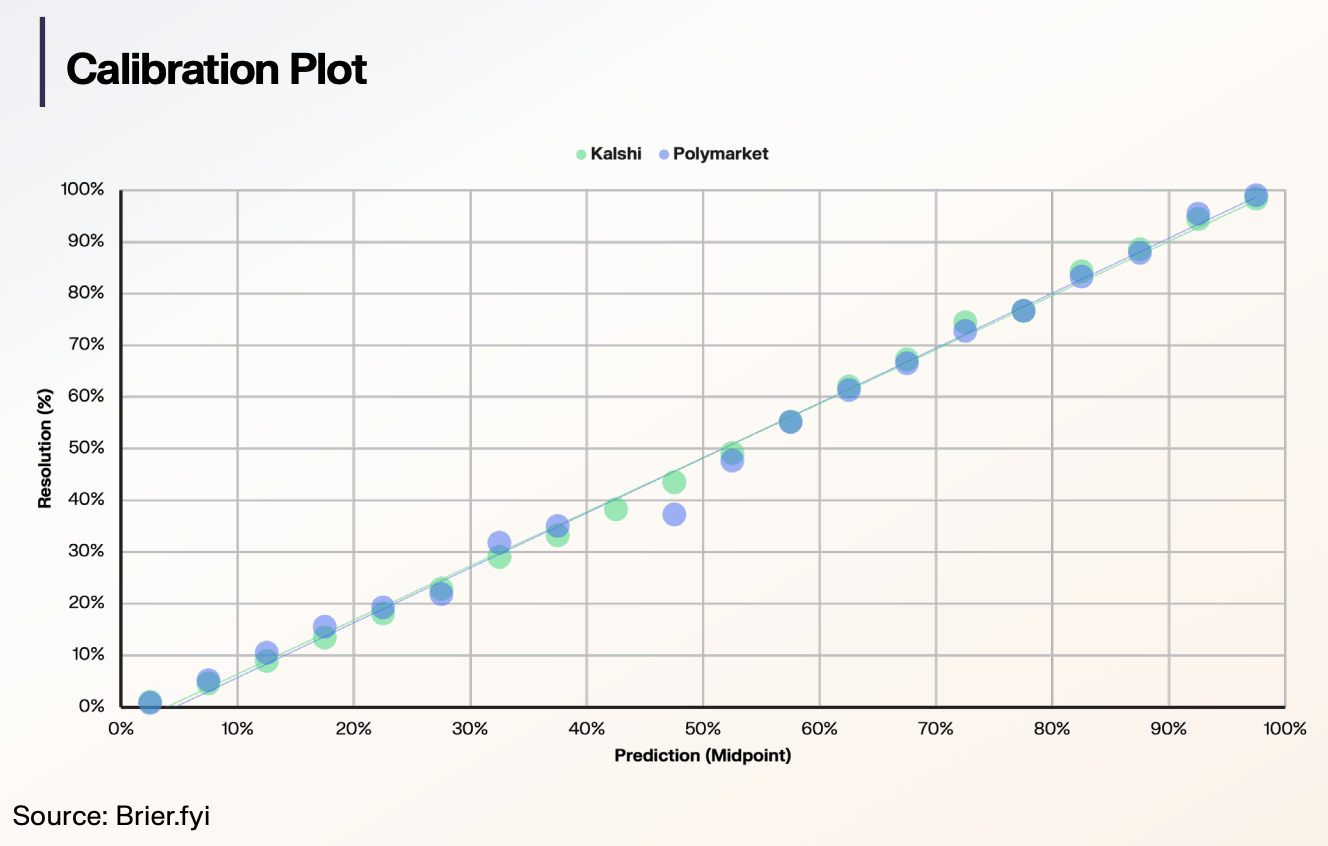
Together, they exceed 540,000 resolved markets with strong calibration. Events priced at 30% happen roughly 30% of the time. Events priced at 70% happen roughly 70% of the time. Across the entire probability spectrum, the prices hold.
Liquidity and Accuracy: Why Volume Matters
One of the most important findings in our data: higher traded volume correlates consistently with lower Brier scores.
This makes intuitive sense. Liquid markets attract more sophisticated participants — quantitative traders running models, domain experts with private information, professional risk desks extracting mispriced probabilities. Each additional informed trader sharpens the price signal.
In thinly traded markets, a single large order can distort the price. Counterparties are scarce. Information gets incorporated slowly.
The practical implication is clear. The markets most worth trusting are those with the deepest order books and the highest cumulative volume. This is why professional risk desks like Susquehanna matter — when they enter a market, depth can increase by 30x, transforming the price from a noisy signal into a sharp one.
Prediction Markets as Leading Indicators: The Kalshi Inflation Case
Beyond static accuracy, prediction markets also function as leading indicators. They reprice faster than comparable financial instruments when new information arrives.
One striking example: Kalshi’s inflation markets versus FedNow rate expectations. The data shows FedNow is 4.3x more volatile than Kalshi’s inflation market. While FedNow expectations swing sharply around macro releases — often overshooting and correcting — Kalshi’s inflation contracts reprice more smoothly and often earlier, functioning as a leading indicator that anticipates where official data will land.
This is not isolated. Across macro releases, CME FedWatch probabilities and Polymarket’s Federal Reserve markets show strong co-movement around FOMC decisions. But prediction market prices often lead — incorporating information from diverse global participants with access to early regional data, private economic models, or simply better-calibrated priors.
Kalshi’s long-horizon track record is striking. Even 200 days before resolution, its probability estimates are more accurate than expert survey-based forecasts and professional weather models over comparable time horizons.
Why Prediction Markets Are More Accurate: The Structural Advantage
This accuracy is not accidental. It stems from structural features traditional forecasting lacks.
- Financial incentives for accuracy: Every mispriced probability is a profit opportunity. Traders who correct mispricings are rewarded. Those who push prices away from truth lose money. A self-correcting mechanism that polls and expert panels simply do not have.
- Continuous updating: Markets reprice around the clock as new information arrives. Polls are snapshots — they capture a single moment and cannot adapt between publication dates.
- Diverse information aggregation: Markets synthesise signals from thousands of participants with different backgrounds, models, data sources, and geographic perspectives. This is exactly the advantage Hayek described — no single forecaster needs to know everything, because the market compresses fragmented knowledge into a unified signal.
- Skin in the game: Real money filters out noise. You must believe in your forecast enough to risk capital on it. Cheap talk disappears.
- Transparent track record: Every correct and incorrect forecast is recorded on every trade. No selective memory. Accountability is automatic.
The Limits of Prediction Market Accuracy
No forecasting tool is perfect. We see known limitations.
Thinly traded markets can be manipulated or simply lack enough informed participants to produce reliable prices. Markets on novel or unprecedented events — where historical base rates do not exist — show wider Brier score dispersion.
Timing matters too. A market that correctly prices an outcome at 85% one week before resolution may have been wildly off six months earlier. The Brier score captures the full trajectory, but casual observers often focus on the final price — giving a misleading impression of overall accuracy.
Prediction markets can also reflect collective biases. If most participants share the same flawed model, the market can systematically misprice an outcome — until a contrarian with better information trades against the consensus.
Despite these caveats, the aggregate data is unambiguous. Across hundreds of thousands of resolved markets, prediction markets produce the most accurate publicly available probability estimates of any known forecasting method.
What This Means for Decision-Making
The implications go well beyond academic interest.
For policymakers, prediction markets offer a less biased alternative to polling and pundit analysis. For businesses, they provide forward-looking probability estimates that can inform strategic planning, risk management, and capital allocation. For media, they offer a transparent, verifiable signal that can anchor reporting on uncertain events.
As prediction markets scale — more participants, deeper liquidity, expanding categories — accuracy will improve further. The relationship between volume and accuracy suggests a virtuous cycle: better accuracy attracts more sophisticated participants, who bring more liquidity, which sharpens accuracy further.
With both platforms approaching institutional-grade reliability across their core categories, prediction market accuracy is no longer a research finding. It is a practical tool for anyone who makes decisions under uncertainty.